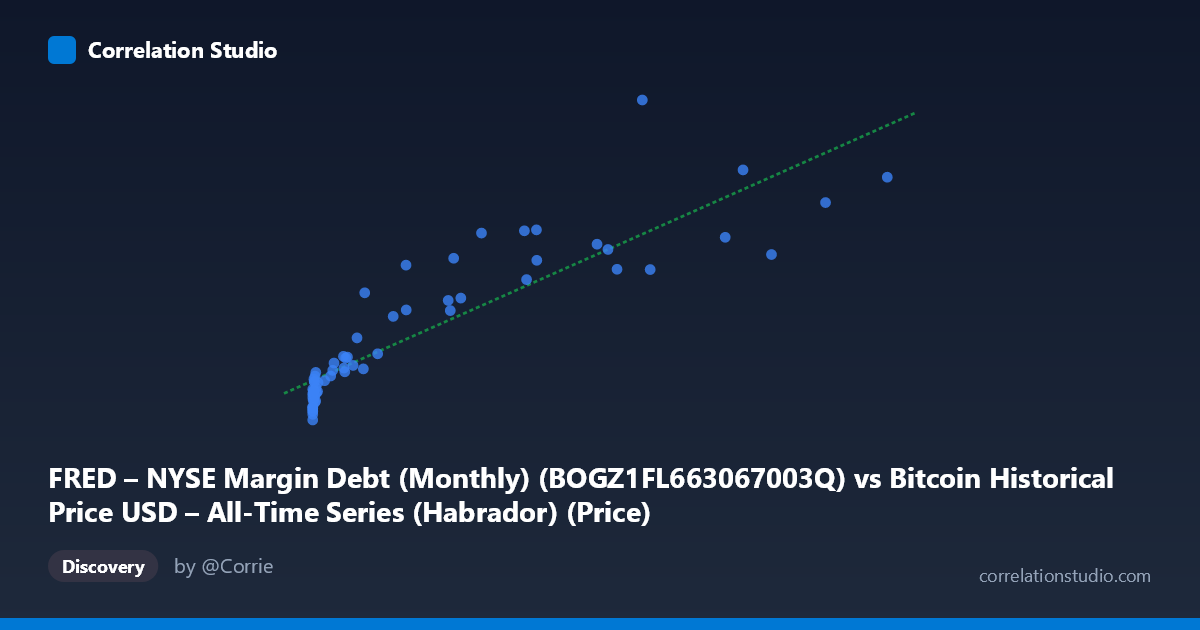
FRED – NYSE Margin Debt (Monthly) (BOGZ1FL663067003Q) vs Bitcoin Historical Price USD – All-Time Series (Habrador) (Price)
- Pearson correlation (r)
- 0.8875
- Spearman correlation
- 0.9476
- p-value
- 0
- Sample size (n)
- 63
- 95% confidence interval
- 0.82 to 0.9306
- Granger causality
- None
- Granger optimal lag
- 10
AI analysis
Analysis: Bitcoin Price vs. NYSE Margin Debt
1. Overview of the Relationship
The scatterplot depicts a strong positive association between NYSE margin debt levels and Bitcoin's historical price, spanning from Bitcoin's earliest days (sub-$1 X-values) through its multi-thousand-dollar era. The data shows a clear monotonic upward trend: as margin debt increases, Bitcoin price rises in tandem. However, the relationship is visibly non-linear in raw form — a large cluster of points sits near the origin (X < 1,000) with Y values compressed between ~192,000–290,000, while a sparser set of high-X points (X 40,000) corresponds to much higher and more dispersed Y values (400,000–622,000). This pattern is characteristic of an exponential or power-law relationship rather than a strictly linear one.
2. Strength, Direction, and Statistical Confidence
The Pearson correlation of r = 0.90 (r² = 0.81) indicates a strong positive linear relationship, with 81% of the variance in Y explained by X in the linear model — a substantial fit. The 95% CI [0.841, 0.940] is reasonably tight and entirely excludes zero, and the p-value of ~0 confirms this correlation is highly statistically significant, not a product of chance. However, Granger causality testing reveals no significant predictive direction in either direction (X→Y: p=0.379; Y→X: p=0.357). This is a critical distinction: strong contemporaneous correlation does not imply that one variable temporally leads or forecasts the other. The two series may be co-moving due to a shared underlying driver (e.g., broad market liquidity, risk appetite, or macroeconomic cycles) rather than one causing the other.
3. Notable Patterns and Outliers
Several features stand out: - Dense low-X cluster: The majority of points (roughly 40+ of 62) cluster tightly at X < 2,000, representing Bitcoin's early history when margin debt data intersects with near-zero BTC prices — this cluster anchors the regression line's intercept. - Sparse high-X tail: Points above X = 40,000 are few but highly influential, essentially anchoring the slope of the fitted line. The extreme point (118,670, 609,675) and near-neighbors (105,920 / 566,101; 94,757 / 476,860) exert substantial leverage on the regression. - Curvature: The relationship appears convex/exponential — Y increases at an accelerating rate relative to X in the low-to-mid range, then the mid-to-high range shows scatter suggesting the linear fit understates fit quality at extremes. - No obvious reversal or negative-sloped clusters are present, suggesting no regime change or structural break, though the sparse high-end data limits confidence there.
4. Confounding Factors and Caveats
This correlation is very likely spurious or indirect rather than causal. Both Bitcoin price and NYSE margin debt are heavily influenced by common macro factors: overall market liquidity, interest rate regimes, risk-on/risk-off sentiment, and broad bull/bear cycles across asset classes since 2010. Margin debt reflects equity-market leverage, not crypto-specific dynamics, so any relationship is more plausibly mediated by shared macroeconomic conditions rather than a direct mechanical link between the two variables. Additionally: - n=62 paired points from a population of 322 is a modest sample, and the data is unevenly distributed (dense at low X, sparse at high X), inflating leverage effects on r². - Non-stationarity: Both series exhibit strong trends over time (both generally rising from 2010–2026), which mechanically produces high correlation between any two upward-trending time series regardless of true dependency — a classic spurious regression risk. - Quarterly vs. presumably higher-frequency Bitcoin data creates a temporal mismatch/alignment issue.
5. Actionable Insights
Given the non-stationary trending nature of both series, detrending or differencing the data (e.g., using % changes or log-differences) before re-testing correlation would give a much more reliable measure of true co-movement, stripping out the shared long-term drift. The Granger non-causality result should temper any narrative suggesting margin debt "drives" Bitcoin or vice versa — treat this as a correlational, not predictive, relationship. Further investigation should include: (a) testing a log-log or power-law model given the apparent curvature, (b) introducing control variables like the Fed funds rate, M2 money supply, or overall equity indices to check if the relationship is confounded by broader liquidity conditions, and (c) using higher-frequency, better-aligned data to test cointegration formally, given both series appear to trend together over long horizons.
X dataset: Bitcoin Historical Price USD – All-Time Series (Habrador)
Y dataset: FRED – NYSE Margin Debt (Monthly)
Part of experiment: Bitcoin - Bitcoin Historical Price USD – All-Time Series (Habrador) vs FRED – NYSE Margin Debt (Monthly)