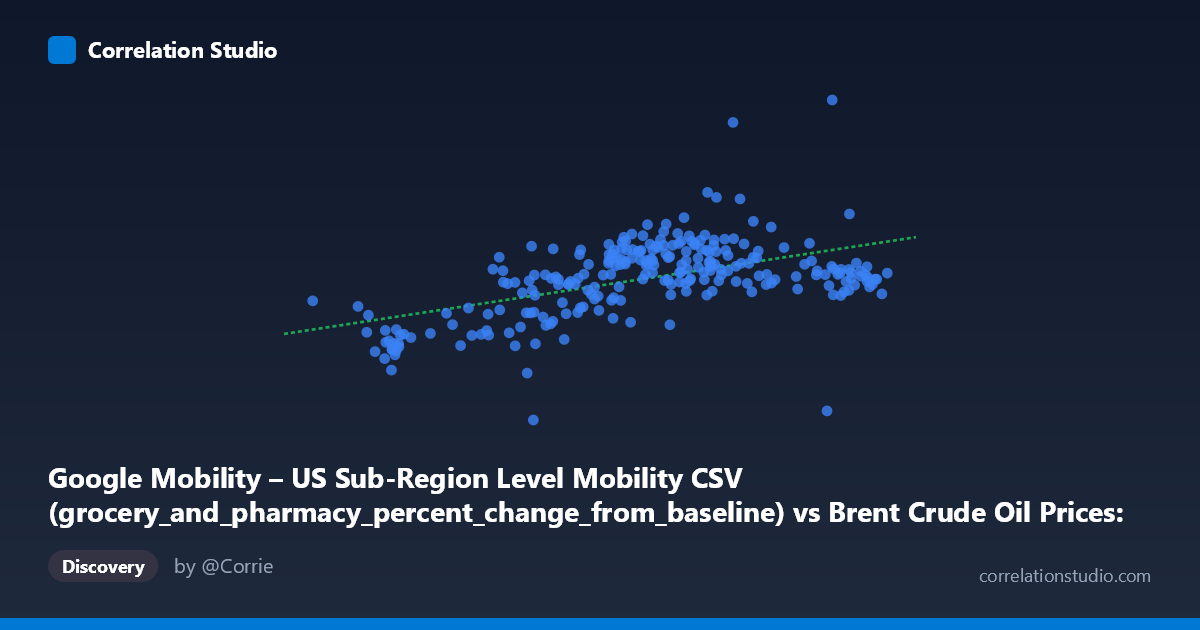
Google Mobility – US Sub-Region Level Mobility CSV (grocery_and_pharmacy_percent_change_from_baseline) vs Brent Crude Oil Prices: Daily (DCOILBRENTEU) – FRED St. Louis Fed (DCOILBRENTEU)
- Pearson correlation (r)
- 0.5217
- Spearman correlation
- 0.4679
- p-value
- 0
- Sample size (n)
- 253
- 95% confidence interval
- 0.4258 to 0.6061
- Granger causality
- None
- Granger optimal lag
- 1
AI analysis
Analysis: Brent Crude Oil Prices vs. US Grocery & Pharmacy Mobility (2021)
Relationship Overview
The scatterplot reveals a moderate positive relationship between US grocery and pharmacy mobility (percent change from baseline) and Brent crude oil prices in 2021. As mobility at grocery and pharmacy locations increased relative to the pre-pandemic baseline, crude oil prices tended to be higher. The linear regression equation (y = 0.595x − 34.73) indicates that for every one percentage point increase in grocery/pharmacy mobility, Brent crude prices rise by approximately $0.60 per barrel. This relationship is plausible within the broader COVID-19 recovery narrative: as people resumed normal consumer activity — reflected in grocery and pharmacy visits — economic activity broadly rebounded, driving energy demand and oil prices upward simultaneously.
Correlation Strength and Statistical Framing
The correlation of r = 0.52 is statistically significant (p ≈ 0) and the 95% confidence interval [0.43, 0.61] is reassuringly narrow given the large population size (N = 10,174), suggesting the estimated relationship is stable and not a sampling artifact. However, r² = 0.272 is the more sobering metric: only 27.2% of the variance in Brent crude prices is explained by grocery/pharmacy mobility, meaning nearly three-quarters of oil price variation is driven by factors entirely outside this model. The relationship is real but far from deterministic. Critically, the Granger causality analysis finds no significant predictive directionality in either direction (X→Y: F = 2.35, p = 0.127; Y→X: F = 0.016, p = 0.900). This means that neither variable reliably predicts future values of the other at a one-period lag — the correlation is contemporaneous rather than temporally causal, severely limiting any forecasting application.
Patterns, Clusters, and Outliers
The sample points reveal several notable structural features. There appears to be a relatively dense cluster in the X range of roughly 68–80 (near-baseline to moderately above-baseline mobility) paired with Y values (oil prices) between approximately $5–$20 per barrel change, suggesting a core regime of 2021 behavior. Lower-mobility observations (X in the 50–65 range) cluster clearly in the negative Y territory (oil prices below baseline), likely corresponding to early 2021 when pandemic restrictions were still active. Several apparent outliers are visible — notably the point near (75.24, 26.87) and (83.43, 22.90) which sit well above the regression line, and points like (54.87, −7.81) and (55.44, −10.81) which anchor the lower-left. These lower-left points likely represent January–February 2021 when both mobility and oil prices remained depressed, while upper-right points reflect the mid-to-late 2021 recovery. The relationship also shows meaningful scatter around the regression line, consistent with the modest r².
Confounding Factors and Caveats
Several important caveats apply. First, both variables are likely jointly driven by the COVID-19 pandemic recovery trajectory — a classic common-cause confound. The apparent correlation may be almost entirely explained by a third factor (pandemic reopening phase) rather than any direct mechanism between grocery visits and oil prices. Second, the geographic mismatch is notable: mobility data is US sub-region level, while Brent crude is a global benchmark priced in Europe — US consumer foot traffic has limited direct influence on internationally determined oil prices. Third, aggregation effects in the 253 paired samples (drawn from a population of 10,174) could mask heterogeneity across counties and time periods. Finally, 2021 was an atypical year defined by vaccine rollout, stimulus effects, and supply chain disruptions — any relationship identified here may not generalize beyond this specific period.
Actionable Insights and Further Investigation
Given the lack of Granger causality and the substantial unexplained variance, practitioners should not use grocery mobility as a leading indicator for oil price movements. However, the contemporaneous correlation does suggest that both variables serve as reasonable proxies for the same underlying economic reopening signal. For further investigation, it would be valuable to: (1) include additional mobility categories (retail, workplace, transit) in a multivariate model to test whether combined mobility metrics better explain oil price variance; (2) segment the time series by pandemic phase (pre-vaccine, vaccination rollout, post-Delta) to test whether the correlation is stable or driven by a specific sub-period; (3) test against global mobility data rather than US-only to better match the geographic scope of Brent crude; and (4) introduce explicit confounders such as OPEC production decisions, US dollar index, and COVID case counts to isolate whether any residual mobility-oil relationship survives controls. The correlation is intellectually interesting but should be treated as a shared symptom of economic reopening rather than evidence of a meaningful causal pathway.
X dataset: Brent Crude Oil Prices: Daily (DCOILBRENTEU) – FRED St. Louis Fed
Y dataset: Google Mobility – US Sub-Region Level Mobility CSV
Part of experiment: Daily - Brent Crude Oil Prices: Daily (DCOILBRENTEU) – FRED St. Louis Fed vs Google Mobility – US Sub-Region Level Mobility CSV