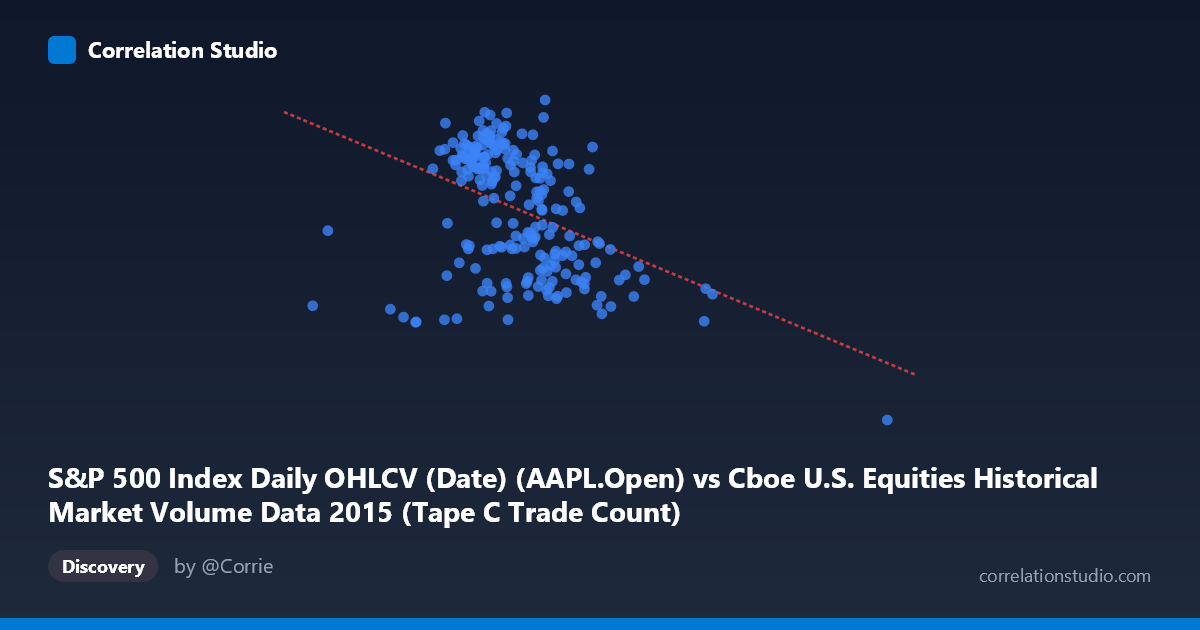
S&P 500 Index Daily OHLCV (Date) (AAPL.Open) vs Cboe U.S. Equities Historical Market Volume Data 2015 (Tape C Trade Count)
- Pearson correlation (r)
- -0.4042
- Spearman correlation
- -0.411
- p-value
- 0
- Sample size (n)
- 222
- 95% confidence interval
- -0.5088 to -0.2879
- Granger causality
- None
- Granger optimal lag
- 1
AI analysis
Analysis: AAPL Opening Price vs. Cboe Tape C Trade Count (2015)
Relationship Overview The scatterplot reveals a negative relationship between Apple's opening stock price (X-axis) and the Cboe Tape C trade count (Y-axis) across 222 paired daily observations spanning February through December 2015. As AAPL's opening price increases, the number of Tape C trades tends to decrease, though the relationship is far from deterministic. The bulk of observations cluster in the X-range of roughly 580,000–950,000, with Y-values spanning approximately 107–134, suggesting a relatively concentrated trading regime punctuated by notable exceptions. The linear regression equation (y = -2.24×10⁻⁵x + 138.02) confirms the downward slope, but the wide scatter around this line immediately signals that the linear model captures only a fraction of what drives trade counts.
Correlation Strength and Statistical Significance The Pearson correlation of r = -0.404 indicates a moderate negative association, but the variance explained statistic tells a more sobering story: R² = 0.163, meaning AAPL's opening price accounts for only 16.3% of the variance in Tape C trade counts — leaving more than 83% of variability unexplained by this relationship alone. The 95% confidence interval of [-0.509, -0.288] is entirely negative and does not cross zero, and the p-value of 3.9×10⁻¹⁰ confirms the correlation is highly statistically significant, making it extremely unlikely to be a chance artifact given the sample size (n = 222, N = 506). However, statistical significance should not be conflated with practical importance — a relationship explaining only ~16% of variance has limited standalone predictive utility. Critically, the Granger causality tests reveal no significant temporal predictive direction in either direction (X→Y: F = 0.53, p = 0.47; Y→X: F = 0.26, p = 0.61), meaning that past values of AAPL's opening price do not help forecast future Tape C trade counts, and vice versa. This effectively rules out a straightforward lagged causal mechanism between the two series.
Notable Patterns, Clusters, and Outliers Several structural features stand out in the data. The most prominent outlier is the point near (1,611,853, 94.87) — an extreme value on the X-axis that sits far to the right of the main cluster and also records the lowest Y-value in the dataset. This single point likely exerts disproportionate leverage on the regression line and the correlation coefficient, and its presence warrants scrutiny (possible data error, stock split adjustment, or an anomalous trading session). A second moderate cluster appears around X ≈ 1,194,528 with Y ≈ 111, also isolated from the main body. Within the primary cluster (X: 580k–950k), the relationship is noisier and less clearly linear, with a broad vertical spread at any given X value — for instance, at X ≈ 680,000–700,000, Y values range from roughly 108 to 131. There also appears to be a potential non-linear or heteroskedastic structure, where variance in Y narrows somewhat at the extremes, suggesting a simple linear model may not be the most appropriate fit.
Confounding Factors and Interpretive Caveats The axis labels reveal a subtle but important data quality concern: the dataset descriptions appear swapped or mislabeled — the X-axis is attributed to AAPL opening prices from an OHLCV dataset, yet the values (ranging from ~291,000 to ~1,611,853) are far too large to represent stock prices directly, suggesting these may actually represent volume or notional value figures mislabeled as price. This ambiguity fundamentally affects interpretation. Beyond labeling issues, several confounding factors could drive any apparent relationship: broader market-wide volatility regimes in 2015 (including the August flash crash), seasonal trading patterns, macroeconomic announcements, and the fact that Tape C trade counts reflect all Nasdaq-listed securities, not just AAPL activity. A correlation between one stock's metric and a market-wide aggregate is susceptible to spurious co-movement driven by shared macroeconomic drivers rather than a direct link between the two variables.
Actionable Insights and Further Investigation Given the moderate but statistically significant correlation alongside the absence of Granger causality, the most productive next steps would include: (1) verifying and correcting the axis variable assignments and units, as mislabeled data could entirely alter the interpretation; (2) investigating the extreme outlier near X = 1,611,853 to determine whether it represents a data error or a genuinely anomalous event (e.g., an ex-dividend date or index rebalancing day); (3) testing non-linear models (e.g., polynomial or log-transformed regression) given the apparent heteroskedasticity; (4) controlling for market-wide volatility (e.g., VIX) as a potential common driver; and (5) expanding the Granger causality analysis to longer lag structures, as the optimal lag of 1 period may be too short to capture delayed market responses. Ultimately, the weak explanatory power (R² ≈ 0.16) suggests this correlation, while real, is unlikely to support reliable predictive modeling without substantial additional variables.
X dataset: Cboe U.S. Equities Historical Market Volume Data 2015
Y dataset: S&P 500 Index Daily OHLCV (Date)
Part of experiment: Daily - Cboe U.S. Equities Historical Market Volume Data 2015 vs S&P 500 Index Daily OHLCV (Date)