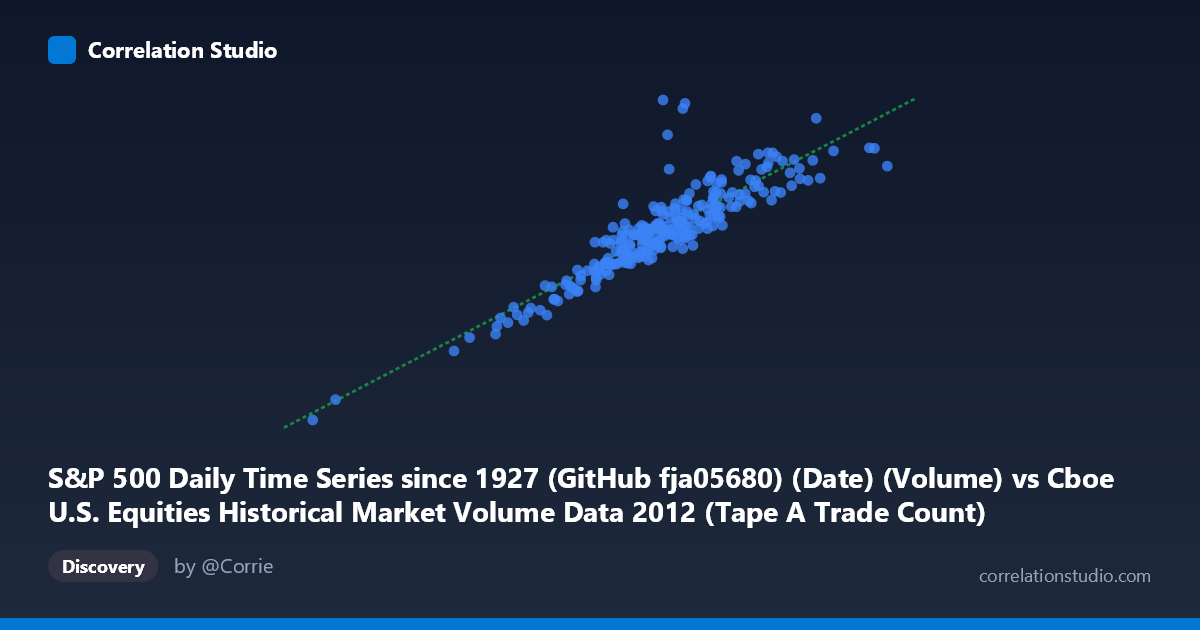
S&P 500 Daily Time Series since 1927 (GitHub fja05680) (Date) (Volume) vs Cboe U.S. Equities Historical Market Volume Data 2012 (Tape A Trade Count)
- Pearson correlation (r)
- 0.8901
- Spearman correlation
- 0.8992
- p-value
- 0
- Sample size (n)
- 250
- 95% confidence interval
- 0.8611 to 0.9133
- Granger causality
- None
- Granger optimal lag
- 10
AI analysis
Analysis: S&P 500 Trading Volume vs. Cboe Tape A Trade Count (2012)
Relationship Overview The scatterplot reveals a strong, positive linear relationship between S&P 500 daily trading volume and Cboe Tape A trade counts across 2012. As daily volume increases, the number of individual trades recorded on Tape A rises correspondingly, which is intuitive — higher volume days naturally generate more discrete transactions. The linear regression equation (y = 3,509.76x + 1.099×10⁸) suggests that for every additional unit of S&P 500 volume, Tape A trade counts increase by approximately 3,510 transactions, with a substantial baseline intercept reflecting baseline market activity independent of S&P 500 volume alone.
Correlation Strength and Statistical Significance The correlation is strong (r = 0.8901), and the R² of 0.7923 means that roughly 79.2% of the variance in Tape A trade counts is explained by S&P 500 volume — a notably high figure for financial market data. The 95% confidence interval [0.8611, 0.9133] is narrow, indicating high precision in this estimate across the full population of 3,750 trading periods. The p-value of effectively zero confirms this relationship is not a statistical artifact. However, the Granger causality results complicate any directional narrative: neither X→Y (F=1.41, p=0.178) nor Y→X (F=1.27, p=0.250) achieves statistical significance at the optimal 10-period lag. This means that while the two series are strongly correlated contemporaneously, neither variable reliably predicts the future values of the other — the relationship appears synchronous rather than predictive.
Notable Patterns, Clusters, and Outliers The data forms a reasonably tight linear cloud, consistent with the high R², but several features deserve attention. There is a visible outlier near (1,004,727, 5,271,490,000) — a data point where Tape A trade count is dramatically elevated (~45% above the regression line) despite average volume, suggesting an anomalous trading event, possibly tied to a high-volatility news day in 2012. A modest lower-left cluster around volumes of 730,000–800,000 with trade counts near 2.5–2.8 billion represents quieter market days, likely summer or holiday-adjacent sessions. The spread around the regression line appears to widen slightly at higher volumes, hinting at mild heteroscedasticity — higher-volume days may introduce more variability in how trades are distributed across venues.
Confounding Factors and Caveats Several important caveats apply. First, the axis labels appear to be swapped in the dataset metadata — "Volume" is listed as the X-axis source from the S&P 500 dataset while "Trade Count" comes from the Cboe dataset, yet both measure aspects of market activity, making the directionality of interpretation somewhat ambiguous. Second, this correlation is contemporaneous and structurally driven: both variables respond to the same underlying market conditions (volatility spikes, macroeconomic events, options expiration dates) rather than causally influencing each other, which the Granger results confirm. Third, market structure changes in 2012 — including evolving HFT activity and exchange fragmentation — could create non-stationary relationships within the year. The outlier mentioned above may reflect a specific event such as the Facebook IPO (May 2012) or the Knight Capital trading incident (August 2012), each of which dramatically disrupted normal volume-trade relationships.
Actionable Insights and Further Investigation Practitioners should not use lagged values of one variable to forecast the other given the absence of Granger causality — any predictive model would need to incorporate shared external drivers like the VIX or macro event calendars rather than relying on cross-series lags. The unexplained ~20.8% of variance warrants investigation: adding intraday volatility measures, options expiration flags, or cross-venue volume fragmentation data could substantially improve explanatory power. The outlier should be identified and tagged — if it corresponds to a known structural event, it may need to be excluded or modeled separately. Finally, extending this analysis across multiple years would test whether the strong r=0.89 relationship is stable across different market regimes or specific to 2012's particular trading environment.
X dataset: Cboe U.S. Equities Historical Market Volume Data 2012
Y dataset: S&P 500 Daily Time Series since 1927 (GitHub fja05680) (Date)
Part of experiment: Daily - Cboe U.S. Equities Historical Market Volume Data 2012 vs S&P 500 Daily Time Series since 1927 (GitHub fja05680) (Date)