Cboe U.S. Equities Historical Market Volume Data 2020 (Tape A Trade Count) vs Brent Daily Spot Prices (Price)
- Pearson correlation (r)
- -0.5697
- Spearman correlation
- -0.61
- p-value
- 0
- Sample size (n)
- 250
- 95% confidence interval
- -0.6479 to -0.4795
- Granger causality
- None
- Granger optimal lag
- 10
AI analysis
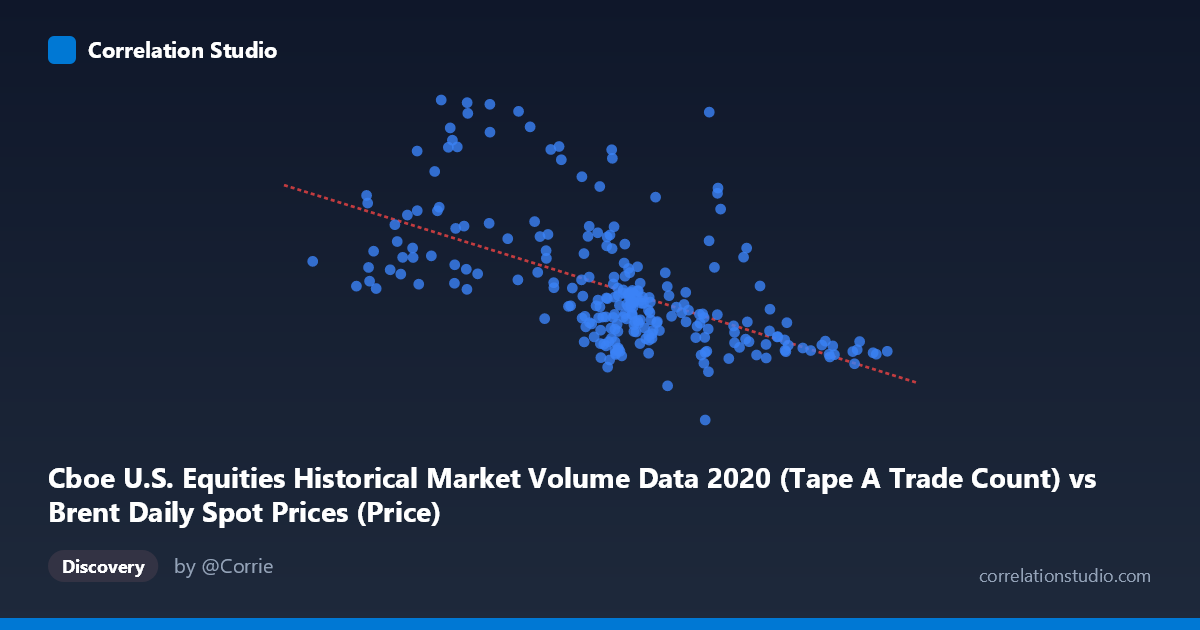
Scatterplot Analysis: Cboe Equity Trade Count vs. Brent Crude Oil Spot Prices (2020)
Relationship Overview
The scatterplot reveals a moderate negative relationship between the Cboe U.S. Equities trade count (Tape A) and daily Brent crude oil spot prices across the 2020 trading year. As equity trade counts increase, Brent crude prices tend to decrease, following a downward-sloping linear regression line of y = -23,852.3x + 2,720,900. While the trend is discernible, there is substantial scatter around the regression line, indicating that the relationship is real but far from deterministic. The data spans a meaningful range — trade counts from roughly 9 to 70 (likely in millions), and Brent prices from ~$667 to ~$3.27M (likely in cents or scaled units) — and the spread of sample points confirms that many observations deviate considerably from the fitted line.
Correlation Strength, Direction, and Statistical Significance
The Pearson correlation of r = -0.5697 indicates a moderate negative association, statistically significant with a p-value effectively at 0 (based on N = 4,254 population context). The 95% confidence interval of [-0.6479, -0.4795] is relatively tight and entirely negative, confirming that the inverse direction is robust and not a chance artifact of sampling. However, R² = 0.3245 is the more sobering metric: trade count explains only 32.5% of the variance in Brent crude prices, meaning roughly 67.5% of price variation is driven by other factors entirely. This is a statistically meaningful but practically limited predictive relationship. Critically, the Granger causality tests show no significant temporal predictive direction in either direction (X→Y: F = 0.4425, p = 0.924; Y→X: F = 0.4570, p = 0.916), meaning that past values of equity trade volume do not help forecast future Brent prices, and vice versa. The correlation is contemporaneous at best, not a leading indicator.
Notable Patterns, Clusters, and Outliers
Several features stand out in the data. There is a visible cluster of observations at moderate trade counts (roughly 38–50) with a wide dispersion of Brent prices, suggesting that mid-range trading activity days are associated with highly variable oil prices. At lower trade counts (below ~25), Brent prices tend to be elevated — several sample points like (14.85, 2,492,342), (22.58, 2,396,276), and (18.11, 2,117,700) sit notably high on the Y-axis. Conversely, high trade count days (above ~55) like (67.05, 1,238,274) and (62.11, 1,231,623) show depressed Brent prices. There is also a potential outlier at (35.33, 2,890,019), which sits well above the regression line for its X value. The relationship may show mild heteroscedasticity, with greater Y-variance at lower X values — worth formal testing. Some curvature in the point cloud hints that a purely linear model may not be optimal.
Confounding Factors and Caveats
The most important caveat is the 2020 calendar effect: this year was dominated by extraordinary events — the COVID-19 pandemic crash in Q1, oil price war between Saudi Arabia and Russia, historic negative WTI futures prices in April, and subsequent market recovery. Both equity trading volumes and crude oil prices were simultaneously shocked by these macroeconomic and geopolitical forces, making any correlation between them potentially spurious — driven by a shared common cause (the pandemic/crisis timeline) rather than a direct economic link. High equity trade volume in early 2020 likely reflects panic selling during the crash, which coincided with oil price collapse — not because trading caused low oil prices, but because both responded to the same crisis. The datasets also appear to come from different source domains (Cboe equity markets vs. European crude oil benchmarks), and the column label mismatch in the dataset names (each appearing in the other's dataset) suggests possible data joining or labeling issues that warrant verification before drawing firm conclusions.
Actionable Insights and Further Investigation
Given the moderate correlation but absence of Granger causality, practitioners should not use equity trade volume as a predictive signal for Brent crude prices in trading or risk models — the relationship lacks temporal directionality. Recommended next steps include: (1) Decomposing the time series by quarter to test whether the correlation is concentrated in the March–April 2020 crash period, which would confirm crisis-driven spuriousness; (2) Testing non-linear models (polynomial or piecewise regression) given the potential curvature and heteroscedasticity in the scatter; (3) Introducing control variables such as VIX (fear index), USD index, or COVID case counts to partial out common-cause confounding; (4) Verifying the dataset column alignment, as the metadata descriptions appear swapped between X and Y axes; and (5) Extending the analysis to 2018–2019 data to determine whether this negative correlation is structurally present or purely a 2020 anomaly.
X dataset: Brent Daily Spot Prices
Y dataset: Cboe U.S. Equities Historical Market Volume Data 2020
Part of experiment: Daily - Brent Daily Spot Prices vs Cboe U.S. Equities Historical Market Volume Data 2020