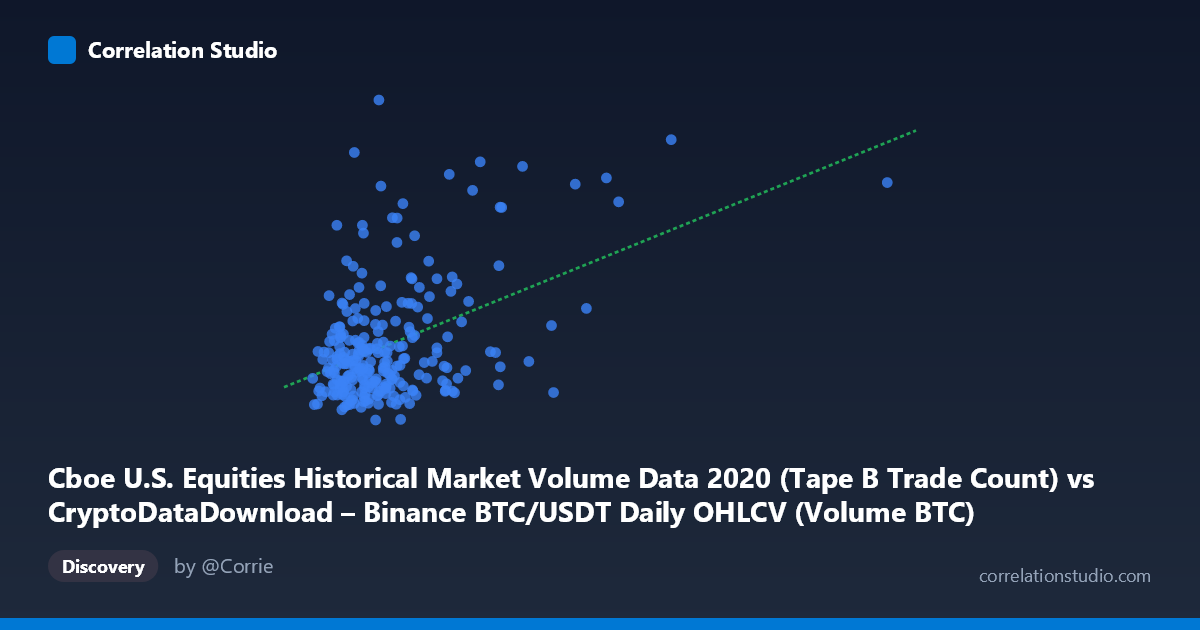
Cboe U.S. Equities Historical Market Volume Data 2020 (Tape B Trade Count) vs CryptoDataDownload – Binance BTC/USDT Daily OHLCV (Volume BTC)
- Pearson correlation (r)
- 0.4434
- Spearman correlation
- 0.2349
- p-value
- 0
- Sample size (n)
- 253
- 95% confidence interval
- 0.3386 to 0.5374
- Granger causality
- None
- Granger optimal lag
- 10
- Time coverage
- 2020-01-02 to 2020-12-31
AI analysis
Analysis: Cboe U.S. Equities Trade Count vs. Binance BTC/USDT Volume (2020)
1. Relationship Overview
The scatterplot shows a modest positive association between Cboe Tape B trade counts and Binance BTC/USDT trading volume across 2020. Most points cluster in the lower-left region (X: 30,000–130,000; Y: 200,000–700,000), with a long right/upper tail created by a handful of extreme observations. The relationship is far from a tight linear band — there's substantial scatter at every X value, suggesting the two series move together only loosely rather than in lockstep.
2. Strength, Direction, and Statistical Confidence
The correlation coefficient (r = 0.443) indicates a weak-to-moderate positive relationship. Critically, r² = 0.197 means only about 20% of the variance in BTC volume is explained by equity trade counts — roughly 80% of BTC volume behavior is driven by other factors entirely. The 95% CI [0.339, 0.537] is reasonably tight and excludes zero, and the p-value (1.3×10⁻¹³) confirms this correlation is highly unlikely to be due to chance in this sample. However, statistical significance here reflects sample size/precision, not practical strength — a correlation can be "real" yet still explain a small fraction of the outcome.
The Granger causality tests are important: neither direction shows significant predictive causality (X→Y: p=0.803; Y→X: p=0.075, only marginally suggestive). This means trade counts do not meaningfully help forecast future BTC volume, nor vice versa, despite the contemporaneous correlation. This is a classic pattern where two variables may share a common external driver (e.g., overall market volatility, macro events, or seasonal trading activity) rather than one causing the other.
3. Notable Patterns and Outliers
Several points strongly deviate from the main cluster and likely disproportionately influence the regression line: - (71155, 1,222,154) — an extreme Y outlier, nearly 3x the mean Y value at a fairly typical X. - (402201, 950,884) — an extreme X outlier (5x+ the mean X) paired with high Y. - (72484, 939,285), (164674, 1,003,994), (79942, 835,180) — several other high-Y points with moderate-to-high X.
These outliers appear to occur at different X levels, contributing to scatter rather than reinforcing a clean trend line. Excluding them would likely reduce r² further, suggesting the already-modest correlation is partly outlier-driven. The bulk of "normal" days show no strong visual trend — X and Y wobble somewhat independently within the core cluster.
4. Confounding Factors and Caveats
This pairing is unusual: it compares a U.S. equities market metric (Cboe Tape B trade count) against a crypto exchange's trading volume (Binance BTC/USDT). Any correlation is likely spurious or mediated by a third factor — most plausibly overall market volatility/risk sentiment in 2020 (COVID-19 crash in March, subsequent stimulus-driven rallies) that simultaneously boosted both equity trading activity and crypto trading activity. Other confounders include: - Shared calendar effects (weekday/weekend patterns, month-end rebalancing) - Macro liquidity conditions (Fed policy, dollar strength) - Retail trading surges (both markets saw new retail participation in 2020)
Additionally, 253 sampled days from a 3,212-point population raises questions about how the sample was selected and whether it's representative of the full year.
5. Suggestions for Further Investigation
- Control for volatility: Introduce a shared volatility index (e.g., VIX or BTC realized volatility) as a covariate to test whether the X-Y correlation disappears once this confound is addressed. - Investigate outliers: Examine what happened on the dates producing the extreme Y values (e.g., 1.22M) — likely specific news/volatility events rather than typical trading days. - Re-run without outliers: A robust/trimmed correlation would clarify how much of the r=0.44 is outlier-driven. - Given the null Granger result, this pairing should not be used for predictive trading models linking equity activity to crypto volume forecasts. - Consider whether a more theoretically motivated pairing (e.g., crypto volume vs. crypto-specific volatility or equity volume vs. equity volatility) would yield more interpretable and actionable relationships.
X dataset: CryptoDataDownload – Binance BTC/USDT Daily OHLCV
Y dataset: Cboe U.S. Equities Historical Market Volume Data 2020
Part of experiment: Bitcoin - CryptoDataDownload – Binance BTC/USDT Daily OHLCV vs Cboe U.S. Equities Historical Market Volume Data 2020