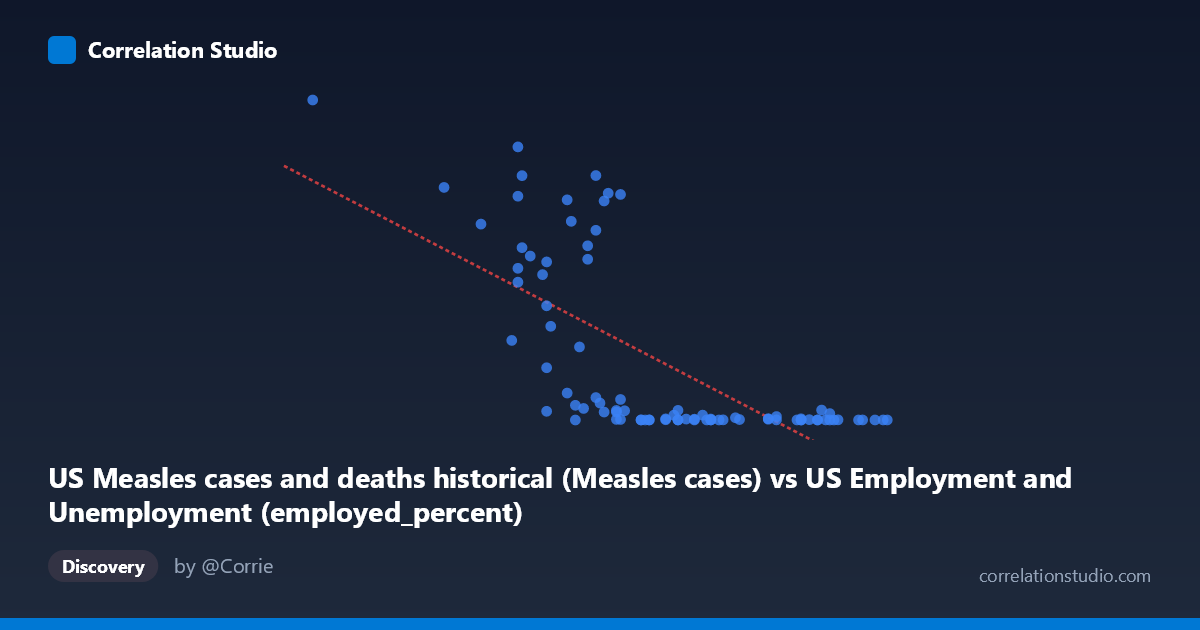
US Measles cases and deaths historical (Measles cases) vs US Employment and Unemployment (employed_percent)
- Pearson correlation (r)
- -0.6865
- Spearman correlation
- -0.7568
- p-value
- 0
- Sample size (n)
- 85
- 95% confidence interval
- -0.7848 to -0.5545
- Granger causality
- None
- Granger optimal lag
- 10
- Time coverage
- 1941-01-01 to 2025-01-01
- Recomputed on refreshed data
- 2026-10-17 (r was -0.6865)
AI analysis
Analysis: US Measles Cases vs. Employment Percentage
Overview of the Relationship
The scatterplot reveals a negative relationship between US Measles cases (X-axis) and the employed percentage of the labor force (Y-axis), spanning data from 1941 to 2025. As measles cases increase, the employment percentage tends to be lower, and conversely, periods of higher employment correspond with dramatically fewer measles cases. The linear regression equation (y = -59,577.5x + 3,671,130) captures this downward trend, though the scatter around this line is substantial, and the data exhibits pronounced non-linear clustering that a single linear model struggles to fully represent. The wide Y-axis range — from 13 to 894,134 measles cases — alongside a comparatively narrow X-axis range (50.4% to 64.4% employment) immediately signals that the measles variable is driving extreme variance in this relationship.
Correlation Strength, Direction, and Statistical Significance
The Pearson correlation of r = -0.687 indicates a moderate-to-strong negative association, with r² = 0.471 meaning that approximately 47.1% of the variance in employment percentage is statistically explained by measles case counts (or vice versa). While nearly half of the variance is accounted for, this also means over 52% remains unexplained by this relationship alone. The 95% confidence interval of [-0.785, -0.555] is meaningfully narrow and entirely negative, confirming the direction of the association with reasonable precision. The p-value of 4.09 × 10⁻¹³ is extraordinarily small, making the correlation statistically significant well beyond conventional thresholds (p < 0.001), effectively ruling out chance as an explanation for this pattern across n = 85 paired observations. However, Granger causality tests reveal no significant predictive temporal direction in either direction — neither X→Y (F = 1.21, p = 0.308) nor Y→X (F = 0.97, p = 0.481) — at the optimal lag of 10 periods. This is a critical finding: the correlation is statistically robust, but neither variable temporally predicts the other, strongly cautioning against any causal interpretation.
Notable Patterns, Clusters, and Outliers
The scatterplot exhibits a pronounced bimodal or clustered structure rather than a smooth linear spread. There is a dense cluster of high measles case counts (roughly 300,000–894,000) concentrated in the lower employment percentage range (approximately 53%–58%), consistent with the pre-vaccination era (1940s–1960s), when both high measles burden and structurally different labor markets coexisted. A separate, tightly packed cluster appears at very low measles counts (near zero, below ~50,000) spread across a wider employment range (56%–65%), representing the post-vaccination era (post-1963 and especially post-1970s). Several notable outliers stand out: the point at (50.4%, 894,134) is extreme on both axes — likely reflecting the Great Depression/early WWII labor disruption combined with peak pre-vaccine measles burden. Points like (57.3%, 683,077) and (56.6%, 615,104) also sit at the high-measles extreme. On the opposite end, values like (64.4%, 85) and (64.3%, 99) represent modern periods of near-elimination of measles with high employment. This clustering pattern strongly suggests the relationship is driven by shared temporal trends (historical era) rather than a direct mechanistic link.
Confounding Factors and Interpretive Caveats
The most significant confounding factor is time itself. Both variables share a common temporal trajectory: measles cases declined precipitously following the introduction of the measles vaccine in 1963 and the expansion of vaccination programs through the 1970s–1980s, while employment rates fluctuated across distinct economic eras (post-WWII boom, stagflation, tech boom, Great Recession, COVID-19). The correlation almost certainly reflects parallel historical trends — the secular decline of measles and the evolution of US labor markets — rather than any biological or economic mechanism linking the two. Additional confounders include population growth (more people = more potential cases and more workers), economic cycles (recessions reduce employment independently of disease), public health infrastructure changes, and demographic shifts. The dataset labels also raise a metadata concern: X is labeled as coming from the "US Employment and Unemployment" dataset while Y is from the "US Measles" dataset, suggesting possible dataset column misattribution that warrants verification before drawing any conclusions. The absence of Granger causality further reinforces that this is a spurious correlation mediated by time.
Actionable Insights and Further Investigation
Given the spurious nature of this correlation, the most important immediate step is controlling for time (year) as a covariate — a partial correlation or multivariate regression including year would likely reduce the measles-employment association substantially or eliminate it. Researchers should decompose the time series into pre-vaccination (pre-1963), early vaccination (1963–1980), and modern (post-1980) eras to examine whether any within-era correlation persists. It would also be valuable to investigate whether economic downturns correlate with measles resurgence through a more plausible mechanism: reduced healthcare access, lower vaccination rates during recessions, or healthcare worker shortages — hypotheses testable with more granular data. A cross-correlation analysis with varying lags (rather than the 10-period optimal used here) and interrupted time series analysis around the 1963 vaccine introduction could clarify the true dynamics. Finally, replacing the raw measles case count with a per-capita or vaccination-adjusted measure would produce a more analytically meaningful variable for any economic comparison.
X dataset: US Employment and Unemployment
Y dataset: US Measles cases and deaths historical
Part of experiment: Yearly - US Employment and Unemployment vs US Measles cases and deaths historical