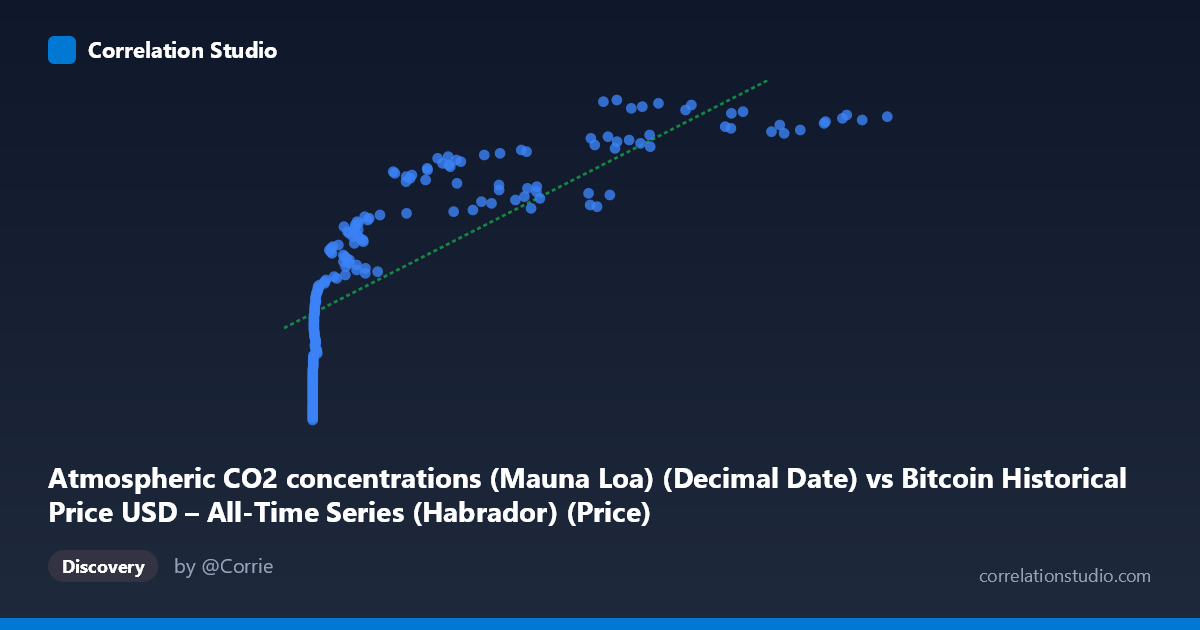
Atmospheric CO2 concentrations (Mauna Loa) (Decimal Date) vs Bitcoin Historical Price USD – All-Time Series (Habrador) (Price)
- Pearson correlation (r)
- 0.8009
- Spearman correlation
- 0.9723
- p-value
- 0
- Sample size (n)
- 189
- 95% confidence interval
- 0.7432 to 0.8469
- Granger causality
- None
- Granger optimal lag
- 1
AI analysis
Analysis: Bitcoin Price vs. Atmospheric CO2 Concentration
1. What the Visualization Reveals
This scatterplot pairs Bitcoin's historical USD price against Mauna Loa atmospheric CO2 readings, matched by date. The plot shows a clear monotonic upward pattern: as CO2 concentrations have risen (2010–2026), Bitcoin's price has also trended upward — but the relationship is distinctly curved, not linear. Low-CO2/early time periods show Bitcoin prices clustered near zero (sub-$1 to low hundreds), while later periods show a steep, almost exponential climb into the tens of thousands. This is a textbook example of two independent time series that both trend strongly in one direction over the same calendar period.
2. Strength, Direction, and Statistical Framing
The Pearson correlation (r = 0.795) is strong and positive, with r² = 0.632 indicating that a linear model explains about 63% of the variance in Y from X. The 95% CI [0.736, 0.843] is tight and excludes zero, and p ≈ 0 confirms this is not a chance finding given the data as sampled. However, statistical significance here reflects the strength of shared trend, not causal linkage. Critically, the Granger causality tests show no significant predictive direction in either direction (X→Y: p=0.53; Y→X: p=0.13). This means neither Bitcoin price nor CO2 levels help forecast the other's future values once past values of each are accounted for — strong evidence that the correlation is driven by a shared confound (time/trend), not by one variable influencing the other.
3. Notable Patterns and Non-linear Features
The data is heavily right-skewed on the X-axis (Bitcoin price ranges from $0.06 to $118,670, spanning nearly 6 orders of magnitude), causing extreme point density near the origin and sparse, high-leverage points at the upper tail (e.g., the $77k–$118k cluster near 2025–2026). The note that Spearman ρ exceeds Pearson r confirms the visible curvature — the relationship resembles a logarithmic or power-law fit better than a straight line. There are no distinct outlier clusters violating the trend; rather, the entire structure is one smooth, monotonic, non-linear arc consistent with two variables that both grow over time (CO2 linearly/seasonally, Bitcoin exponentially through boom-bust cycles).
4. Confounding Factors and Caveats
This is almost certainly a spurious correlation driven by mutual trending with time. CO2 concentration rises steadily and predictably each year due to physical/chemical processes (fossil fuel emissions, seasonal cycles) — a near-deterministic trend. Bitcoin price rises due to speculative demand, adoption cycles, halving events, and macroeconomic factors — entirely unrelated mechanisms. Because both series are non-stationary and increase over the same time window, any two such trending series will show high correlation without any causal or mechanistic link. The Granger test results reinforce this: the "relationship" evaporates once temporal dependency is properly modeled.
5. Actionable Insights
- Do not interpret r² = 0.63 as meaningful shared variance — detrend both series (e.g., first-difference or regress out time) and recompute correlation to test if any residual relationship exists; it will likely collapse toward zero. - Treat CO2 here as a proxy for time, not a genuine explanatory variable for Bitcoin price. - For genuine analysis of Bitcoin price drivers, consider variables with plausible causal mechanisms (interest rates, dollar index, network hash rate, regulatory events, on-chain metrics). - If a real analytical goal exists (e.g., studying long-term macro trends), use cointegration tests rather than raw Pearson/Granger on price levels, and always detrend before correlating two independently-trending time series.
X dataset: Bitcoin Historical Price USD – All-Time Series (Habrador)
Y dataset: Atmospheric CO2 concentrations (Mauna Loa)
Part of experiment: Bitcoin - Bitcoin Historical Price USD – All-Time Series (Habrador) vs Atmospheric CO2 concentrations (Mauna Loa)