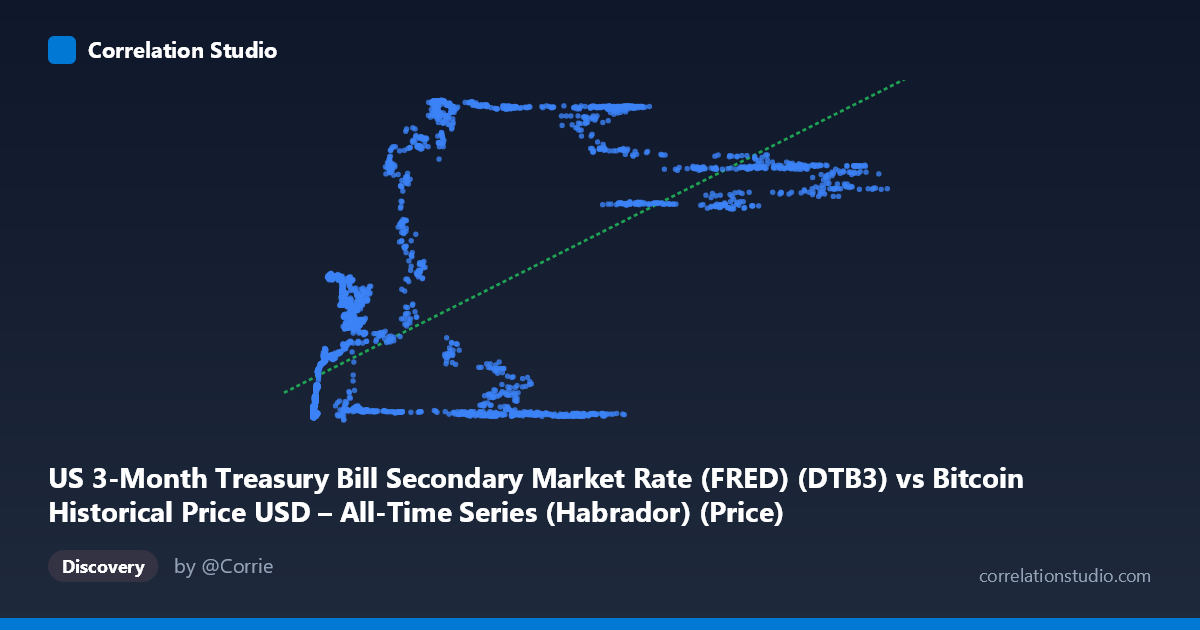
US 3-Month Treasury Bill Secondary Market Rate (FRED) (DTB3) vs Bitcoin Historical Price USD – All-Time Series (Habrador) (Price)
- Pearson correlation (r)
- 0.6515
- Spearman correlation
- 0.6399
- p-value
- 0
- Sample size (n)
- 3946
- 95% confidence interval
- 0.6332 to 0.6691
- Granger causality
- None
- Granger optimal lag
- 1
AI analysis
Analysis: Bitcoin Price vs. US 3-Month Treasury Bill Rate
Note on axis labeling: The variable names appear swapped in the metadata (X is labeled as the T-bill rate but contains Bitcoin-scale values like 124,720; Y is labeled Bitcoin price but ranges only 0–5.36, consistent with T-bill rates in percent). The analysis below treats X as Bitcoin price (USD) and Y as the 3-month T-bill rate (%), matching the actual data ranges.
1. What the Visualization Reveals
The scatterplot shows a moderate-to-strong positive association between Bitcoin's price level and the 3-month T-bill rate. As Bitcoin prices climb into the tens of thousands of dollars, T-bill rates tend to cluster at the higher end (3.5–5.3%), while low Bitcoin prices (under a few thousand dollars) are almost uniformly paired with near-zero rates. This is visible directly in the sample: points like (69590, 4.41), (105400, 4.24), and (60277, 5.24) sit in the high-price/high-rate quadrant, while (6.53, 0.02), (220.17, 0.01), and (34574.67, 0.05) — note this last one, high price but near-zero rate — populate the low-rate region.
2. Strength, Direction, and Statistical Confidence
The correlation coefficient (r = 0.65) indicates a moderate positive relationship, with r² = 0.42 meaning only 42% of the variance in T-bill rates is statistically associated with Bitcoin price levels — the majority (58%) is driven by other factors. The 95% CI [0.633, 0.669] is tight, and p ≈ 0 confirms this correlation is highly unlikely due to sampling noise given the large N (3,946 paired observations). However, statistical significance here reflects sample size, not causal strength or practical predictive power — r² of 0.42 leaves substantial unexplained variance.
Critically, the Granger causality test shows no significant predictive direction in either direction (X→Y: p=0.399; Y→X: p=0.389). This means neither Bitcoin price nor T-bill rates reliably forecast future movements in the other at a 1-period lag. The correlation is likely contemporaneous and coincidental (both trending due to shared macro conditions) rather than one variable driving the other.
3. Notable Patterns and Outliers
Several data points break the simple linear pattern: (34574.67, 0.05), (31659.54, 0.04), (40162.32, 0.03), and (56973.18, 0.06) show high Bitcoin prices paired with near-zero rates — likely capturing the 2020–2021 period when Bitcoin rallied during near-zero Fed rate policy. Conversely, points near (9559.90, 2.09) and (11549.55, 0.10) show inconsistent rate pairings at similar price levels, suggesting Bitcoin price alone doesn't cleanly map to rate regime. This indicates a regime-dependent, non-monotonic relationship rather than a clean linear one — the association appears to strengthen only during the 2022–2024 tightening cycle when both Bitcoin (recovering) and rates (rising from zero to 5%+) moved upward together.
4. Confounding Factors and Caveats
This is a classic case of spurious correlation via shared time trend. Both series are non-stationary and trended over the 2010–2026 window: T-bill rates moved from ~0% (2010–2021 near-zero-rate era) to ~5% (2022–2023 hiking cycle), while Bitcoin appreciated over the same long horizon with massive volatility. Two independent trending series will show correlation without any causal link. Additionally, macro factors (Fed policy, inflation, risk appetite, crypto-specific adoption cycles, regulatory events) plausibly drive both variables independently. The mismatched time coverage and vastly different scales (X: 0.05–124,720; Y: -0.05–5.36) further suggest these series don't share a natural economic mechanism — Bitcoin's price scale has nothing structurally to do with a percentage interest rate.
5. Recommendations for Further Investigation
- Test for stationarity (ADF test) on both series; if both are non-stationary, this r² is likely inflated by trend co-movement, not genuine covariation — consider differencing or working with returns/rate changes instead of levels. - Segment by monetary policy regime (ZIRP 2010–2021 vs. hiking cycle 2022+) to check if correlation holds within regimes or only exists at the regime boundary. - Given the null Granger result, do not use T-bill rates as a short-term predictive signal for Bitcoin price (or vice versa) in trading models. - Explore a third-variable/confounder model (e.g., inflation expectations, Fed funds rate, risk-on/risk-off sentiment indices) as a more economically meaningful driver of both series.
X dataset: Bitcoin Historical Price USD – All-Time Series (Habrador)
Y dataset: US 3-Month Treasury Bill Secondary Market Rate (FRED)
Part of experiment: Bitcoin - Bitcoin Historical Price USD – All-Time Series (Habrador) vs US 3-Month Treasury Bill Secondary Market Rate (FRED)