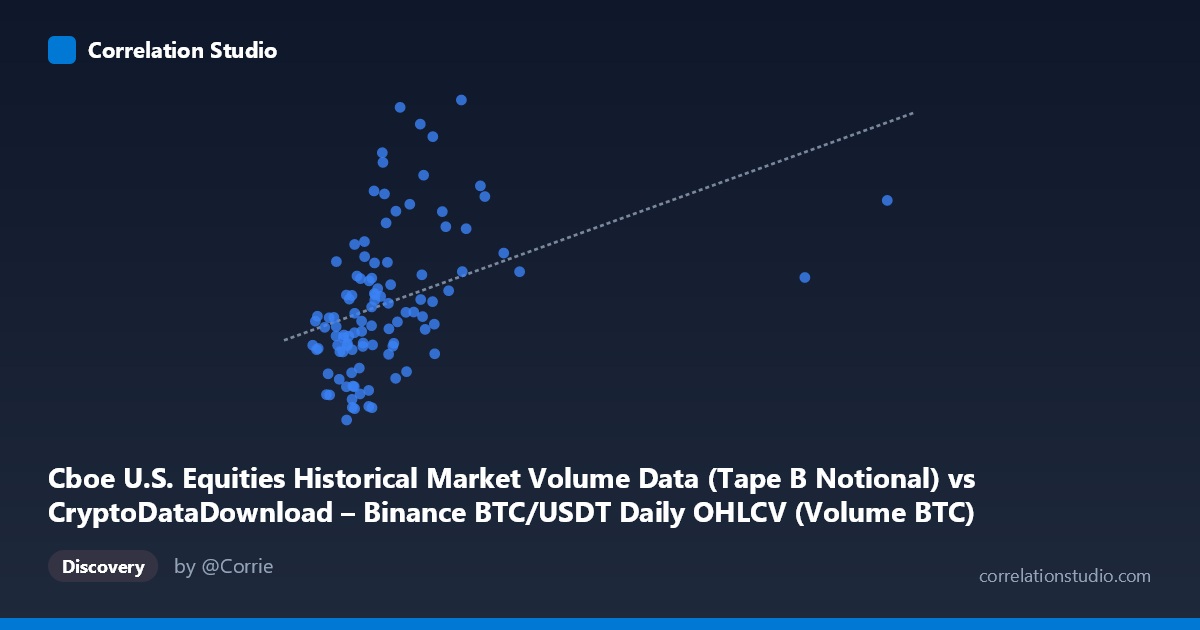
Cboe U.S. Equities Historical Market Volume Data (Tape B Notional) vs CryptoDataDownload – Binance BTC/USDT Daily OHLCV (Volume BTC)
- Pearson correlation (r)
- 0.3943
- Spearman correlation
- 0.5525
- p-value
- 0.000035
- Sample size (n)
- 104
- 95% confidence interval
- 0.2183 to 0.5454
- Granger causality
- None
- Granger optimal lag
- 10
AI analysis
Analysis: Cboe Equities Volume vs. Binance BTC/USDT Volume
1. Overview of the Relationship
The scatterplot displays a weak-to-moderate positive relationship between Cboe U.S. equities notional volume (X) and Binance BTC/USDT trading volume (Y). Most observations cluster tightly in the lower-left region (X: 10,000–30,000; Y: 8–15 billion), with a sparse tail of higher-X values extending to ~106,000. This clustering pattern—dense core plus scattered high-leverage points—is typical of financial volume data, which often exhibits right-skewed distributions punctuated by occasional high-activity days.
2. Strength, Direction, and Statistical Confidence
The correlation coefficient (r = 0.40) indicates a positive but modest linear association. Critically, r² = 0.161 means only about 16% of the variance in Binance BTC volume is explained by Cboe equity volume—leaving 84% attributable to other factors (crypto-specific volatility, news events, derivatives expirations, etc.). The 95% CI [0.212, 0.562] is fairly wide and does not include zero, and the p-value (8.8 × 10⁻⁵) confirms this correlation is statistically significant and unlikely due to chance in this sample. However, statistical significance here reflects a real but weak relationship, not a strong predictive one.
Importantly, the Granger causality tests show no significant predictive direction in either direction (X→Y: p=0.62; Y→X: p=0.66). This means that past values of equity volume do not help forecast future BTC volume, and vice versa—despite the contemporaneous correlation. This is a key distinction: the two series may move together at times without one temporally driving the other, suggesting the relationship (if real) is likely driven by shared external factors rather than a lead-lag mechanical link.
3. Notable Patterns and Outliers
Several high-X outliers (e.g., X ≈ 92,539 and 106,299) sit far from the main cluster but don't show correspondingly extreme Y values—suggesting these points may exert disproportionate leverage on the regression line without representing a genuine trend. Within the main cluster, Y values span widely (7–21 billion) for similar X ranges (15,000–25,000), indicating substantial unexplained scatter at any given X level. The note that Spearman ρ exceeds Pearson r suggests a monotonic but non-linear relationship might fit better—possibly logarithmic given the heavy right-skew in X (mean 23,332 vs. stdev 13,655, with a max nearly 5x the mean).
4. Confounding Factors and Caveats
Both variables are volume metrics from entirely different asset classes (equities vs. crypto) that could be jointly influenced by macro conditions—market-wide volatility spikes, risk-on/risk-off sentiment, options expiration dates, or major news events—without any direct causal link between equities and crypto trading activity. Additionally, with n=90 sampled from a population of 1,980, the small sample size limits precision (as reflected in the wide CI), and calendar effects (weekends, holidays) may differently affect equities vs. 24/7 crypto markets, introducing noise unrelated to any true relationship.
5. Recommendations
Given the failed Granger tests and modest r², this correlation should not be used for predictive trading signals. Instead, consider: (1) testing a log-log or log-linear model given the skewed X distribution and Spearman/Pearson discrepancy; (2) controlling for known confounders like overall market volatility (e.g., VIX) or calendar effects; (3) extending the time series beyond 90 points to narrow the confidence interval and improve Granger test power; and (4) investigating whether specific high-volume equity days (outliers) correspond to identifiable market events that coincidentally elevated crypto volume, rather than assuming a structural relationship.
X dataset: CryptoDataDownload – Binance BTC/USDT Daily OHLCV
Y dataset: Cboe U.S. Equities Historical Market Volume Data
Part of experiment: Bitcoin - CryptoDataDownload – Binance BTC/USDT Daily OHLCV vs Cboe U.S. Equities Historical Market Volume Data