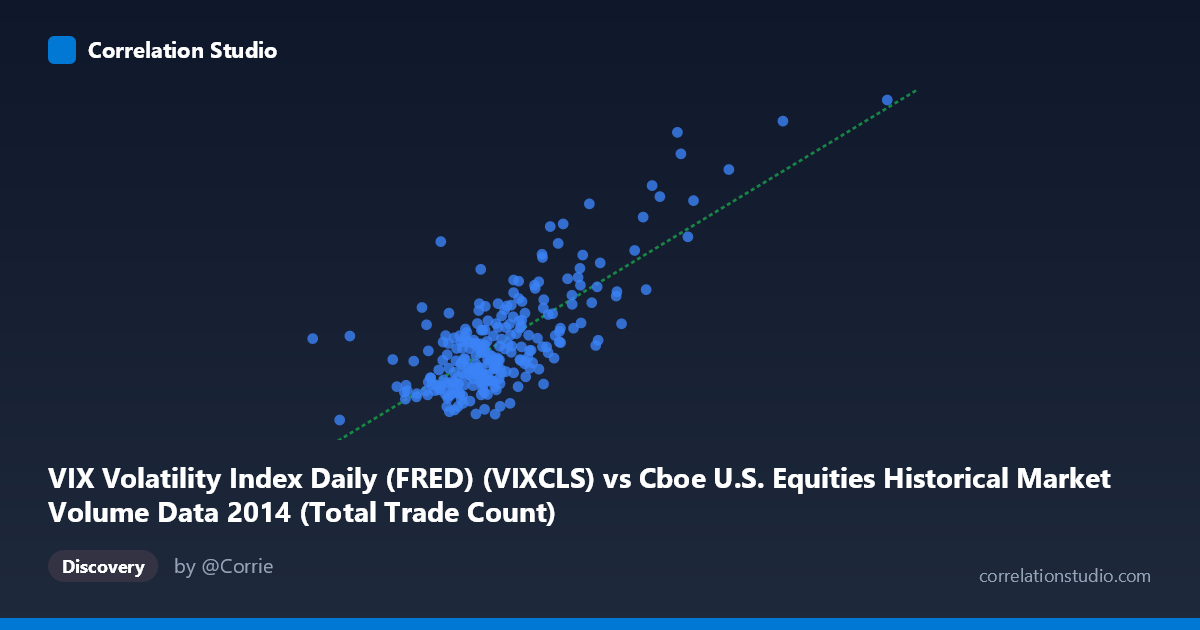
VIX Volatility Index Daily (FRED) (VIXCLS) vs Cboe U.S. Equities Historical Market Volume Data 2014 (Total Trade Count)
- Pearson correlation (r)
- 0.7603
- Spearman correlation
- 0.6168
- p-value
- 0
- Sample size (n)
- 252
- 95% confidence interval
- 0.7028 to 0.808
- Granger causality
- None
- Granger optimal lag
- 1
AI analysis
Analysis: VIX Volatility Index vs. Total Trade Count (2014)
Relationship Overview The scatterplot reveals a clear positive relationship between the VIX Volatility Index and total U.S. equity trade counts throughout 2014. As market volatility increases, trading activity measurably rises — a relationship that aligns intuitively with market microstructure theory: fearful or uncertain markets drive higher transactional volume as participants rebalance, hedge, or exit positions. The linear regression equation (y = 4.97×10⁻⁶x + 3.946) confirms this upward slope, and the visual pattern shows a reasonably coherent trend from lower-left to upper-right, though with notable dispersion at higher VIX values.
Correlation Strength and Statistical Significance The correlation of r = 0.7603 is statistically strong and highly significant (p ≈ 0), with the 95% confidence interval of [0.703, 0.808] indicating a tight and reliable estimate given the paired sample of n = 252. However, r² = 0.578 is the more meaningful metric here: VIX explains approximately 57.8% of the variance in trade counts, leaving roughly 42% attributable to other factors. This is a substantial but incomplete explanation, cautioning against treating VIX as a sole predictor. Importantly, Granger causality is non-significant in both directions (X→Y: F = 3.06, p = 0.082; Y→X: F = 0.10, p = 0.758), meaning that despite the strong contemporaneous correlation, neither variable reliably predicts the other in a temporal lead-lag sense at a 1-period lag. This distinction is critical — correlation here may reflect simultaneous co-movement driven by common external shocks rather than a directional causal mechanism.
Notable Patterns, Clusters, and Outliers The data reveals at least two distinct behavioral zones. The bulk of observations cluster between VIX values of roughly 11–17 and trade counts of 1.5M–2.5M, representing typical low-to-moderate volatility trading days. However, a sparse but influential high-VIX cluster emerges above VIX = 20 (notably points near 23.6, 25.2), corresponding to trade counts exceeding 3M–3.8M. These upper-right outliers — likely associated with market stress episodes in late 2014 (e.g., October volatility spike driven by Ebola fears and Fed tapering concerns) — exert disproportionate leverage on the regression fit. One low-end anomaly near X = 920,402 with Y ≈ 14.4 also warrants attention as a potential data irregularity or holiday-period observation.
Confounding Factors and Caveats Several confounds complicate causal interpretation. Day-of-week and seasonal effects systematically influence both VIX levels and trading volume independently. Macro events (Fed announcements, earnings seasons, geopolitical shocks) simultaneously elevate both variables, potentially inflating the apparent correlation. The dataset covers only one calendar year (2014), which limits generalizability — 2014 was characterized by a prolonged low-volatility regime punctuated by sharp spikes, making the relationship potentially non-representative of other market regimes. Additionally, the non-linear fan-like dispersion at higher VIX values suggests heteroscedasticity, meaning a linear model may underfit the extremes and a log-linear or piecewise model could be more appropriate.
Actionable Insights and Further Investigation Practitioners could use VIX as a regime indicator for expected trading infrastructure load — the correlation is strong enough to inform capacity planning for exchanges and brokers during elevated volatility periods. For further investigation: (1) test non-linear (log or polynomial) regression given apparent heteroscedasticity; (2) extend the analysis across multiple years to assess regime dependency of this relationship; (3) apply rolling-window correlations to identify whether the relationship strengthens specifically around known volatility events; (4) introduce controls for day-of-week, options expiration dates, and macro announcements to isolate the pure volatility-volume channel; and (5) explore whether specific exchange venues drive the aggregate trade count response disproportionately during high-VIX periods.
X dataset: Cboe U.S. Equities Historical Market Volume Data 2014
Y dataset: VIX Volatility Index Daily (FRED)
Part of experiment: Daily - Cboe U.S. Equities Historical Market Volume Data 2014 vs VIX Volatility Index Daily (FRED)