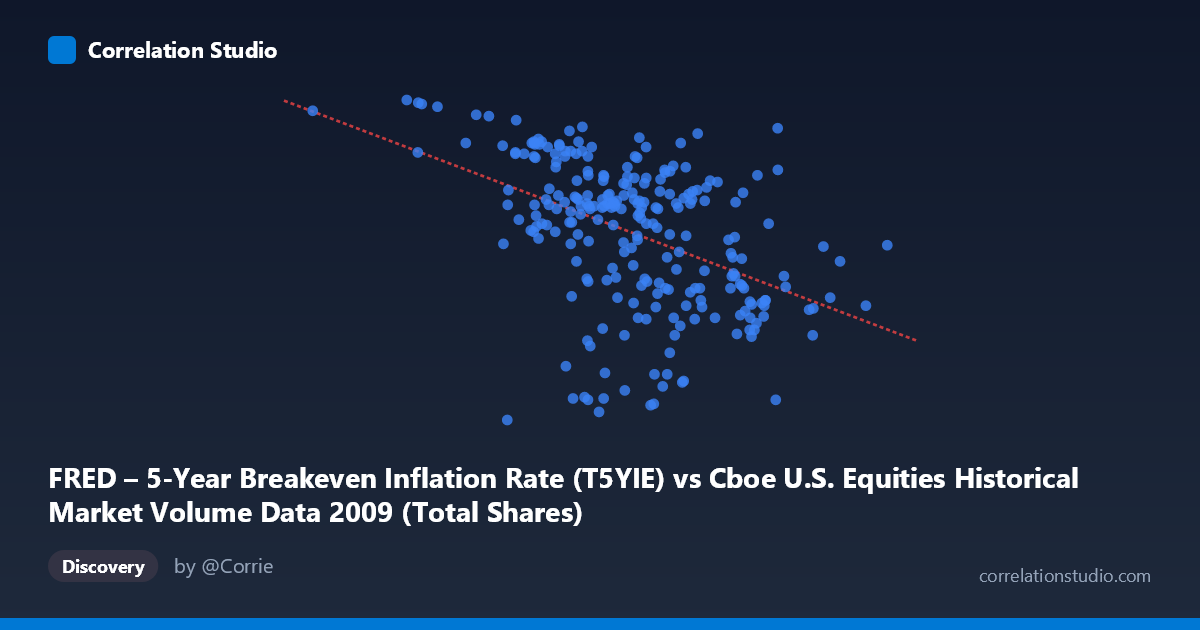
FRED – 5-Year Breakeven Inflation Rate (T5YIE) vs Cboe U.S. Equities Historical Market Volume Data 2009 (Total Shares)
- Pearson correlation (r)
- -0.4536
- Spearman correlation
- -0.4727
- p-value
- 0
- Sample size (n)
- 250
- 95% confidence interval
- -0.5469 to -0.3491
- Granger causality
- None
- Granger optimal lag
- 1
AI analysis
Scatterplot Analysis: 5-Year Breakeven Inflation Rate vs. Cboe U.S. Equities Market Volume (2009)
Relationship Overview
The scatterplot reveals a negative relationship between U.S. equity market trading volume (X-axis) and the 5-year breakeven inflation rate (Y-axis) across 2009. As daily trading volume increases, inflation expectations as measured by the breakeven rate tend to decline. The linear regression equation (y = -1.589×10⁻⁹x + 2.350) captures this downward slope, though the scatter around the regression line is considerable. Visually, the cloud of points tilts from the upper-left toward the lower-right, consistent with the negative correlation, but with enough dispersion to suggest this relationship is far from deterministic. Notably, some extreme values — particularly a cluster of high-volume days associated with lower breakeven rates and a few low-volume days near the upper-left with elevated inflation expectations — anchor the directional trend.
Correlation Strength and Statistical Significance
The Pearson correlation of r = -0.4536 indicates a moderate negative association, but the explanatory power is modest: r² = 0.2057 means only ~20.6% of the variance in breakeven inflation rates is explained by trading volume, leaving roughly 79% attributable to other factors. The 95% confidence interval for r of [-0.5469, -0.3491] is entirely negative, confirming the direction of the relationship is reliable, and the p-value of 4.35×10⁻¹⁴ is overwhelmingly significant given n = 250, ruling out chance as an explanation. However, statistical significance here is partly a function of sample size — practical significance is more constrained given the modest r². Critically, the Granger causality tests show no significant predictive directionality in either direction (X→Y: F = 0.057, p = 0.812; Y→X: F = 0.205, p = 0.651), meaning neither variable reliably predicts future values of the other in a lagged temporal framework. This decouples statistical correlation from any mechanistic or predictive relationship.
Notable Patterns, Clusters, and Outliers
Several features stand out in the data. There is a dense central cluster of points concentrated roughly between 600–900 million shares in volume and 0.5–1.8 in breakeven rate, suggesting this represents typical market conditions in 2009. A handful of outliers at very low volumes (below ~400 million shares, including the minimum at ~192 million) correspond to notably high breakeven rates near 2.0–2.13, consistent with early 2009 when markets were extremely dislocated and inflation expectations were volatile post-crisis. Conversely, high-volume days exceeding 1 billion shares are associated with lower breakeven readings (near 0.4–0.6), potentially reflecting peak crisis trading activity when deflation fears were more prominent. The spread of Y values at any given X value is wide, reinforcing that volume alone is a weak predictor of inflation expectations on any given day.
Confounding Factors and Interpretive Caveats
The most important caveat is that 2009 was a structurally anomalous year — spanning the depths of the global financial crisis, the market bottom in March, and a dramatic recovery by year-end. Both variables were simultaneously driven by macroeconomic shocks (Federal Reserve intervention, credit market stress, economic contraction), making it highly probable that the observed correlation is spurious or confounded by common underlying drivers rather than reflecting a direct relationship. Trading volume surges in crisis periods likely reflect panic and deleveraging, while low breakeven rates in the same periods reflect deflation fears, both caused by the same macro environment. Additionally, the mislabeling in the dataset metadata (X and Y axis descriptions appear swapped) warrants caution in interpretation. The Granger test's null result further supports the conclusion that no causal channel connects these variables temporally.
Actionable Insights and Further Investigation
Given that the correlation appears crisis-driven and contextually specific, several follow-up analyses would be valuable. Segmenting the data by market regime — pre-crisis, crisis trough (Q1 2009), and recovery — would reveal whether the correlation holds consistently or is driven entirely by a specific sub-period. Controlling for the VIX or credit spreads as proxies for macro stress would help isolate whether the volume-inflation relationship persists after removing the common crisis factor. Extending the analysis across multiple years (e.g., 2003–2019) using the full FRED breakeven series would test whether this negative relationship is a durable structural feature or a 2009 artifact. Finally, incorporating Federal Reserve balance sheet data or Treasury issuance as additional covariates could better model the inflation expectations channel, since TIPS-derived breakevens are directly influenced by monetary policy signals that may independently affect trading behavior.
X dataset: Cboe U.S. Equities Historical Market Volume Data 2009
Y dataset: FRED – 5-Year Breakeven Inflation Rate
Part of experiment: Daily - Cboe U.S. Equities Historical Market Volume Data 2009 vs FRED – 5-Year Breakeven Inflation Rate