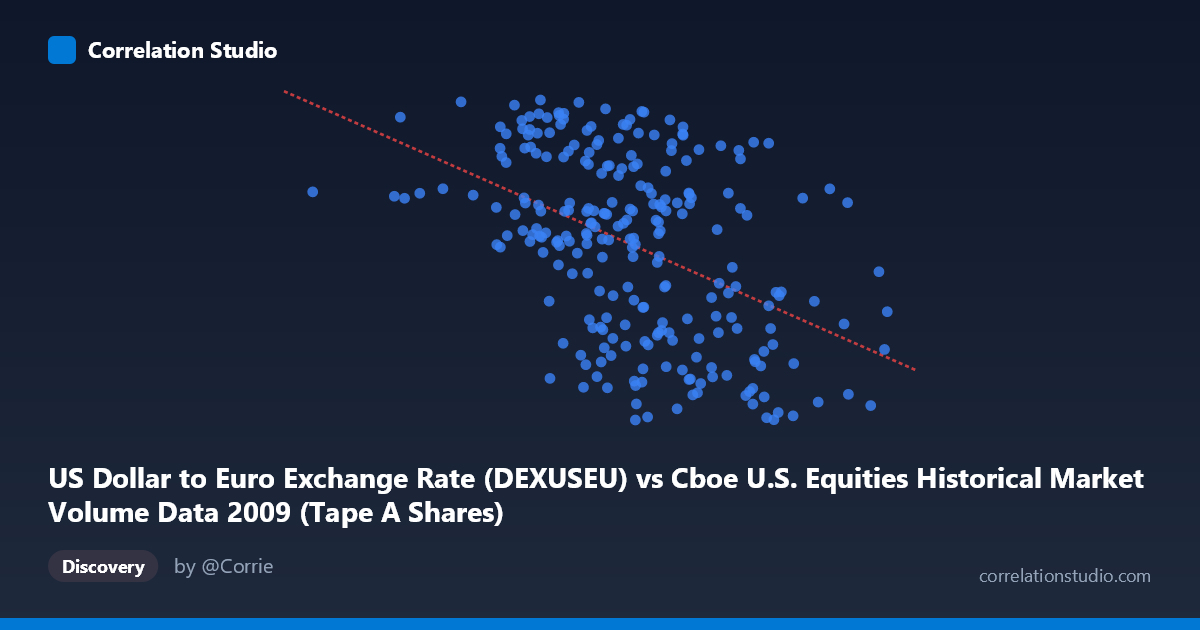
US Dollar to Euro Exchange Rate (DEXUSEU) vs Cboe U.S. Equities Historical Market Volume Data 2009 (Tape A Shares)
- Pearson correlation (r)
- -0.456
- Spearman correlation
- -0.4425
- p-value
- 0
- Sample size (n)
- 250
- 95% confidence interval
- -0.549 to -0.3519
- Granger causality
- None
- Granger optimal lag
- 1
AI analysis
Scatterplot Analysis: USD/EUR Exchange Rate vs. Cboe U.S. Equities Market Volume (2009)
Relationship Overview
The scatterplot reveals a moderate negative relationship between U.S. equity market trading volume (Tape A Shares) and the USD/EUR exchange rate across 2009. As trading volume increases, the dollar tends to weaken against the euro (higher EUR per USD ratio), or conversely, higher exchange rate values (stronger dollar) correspond with lower trading volumes. The linear regression equation (y = -3.38×10⁻¹⁰x + 1.54265) confirms this inverse relationship, with the negative slope indicating that each additional share in volume is associated with a very slight but statistically meaningful decline in the exchange rate. The data spans a full calendar year (January–December 2009), capturing the tail end of the financial crisis and subsequent recovery — a period of exceptional market volatility that makes this relationship particularly complex to interpret.
Correlation Strength and Statistical Significance
The Pearson correlation of r = -0.456 indicates a moderate negative association, but the explanatory power deserves careful framing: r² = 0.208 means only 20.8% of the variance in the exchange rate is explained by trading volume, leaving nearly 80% attributable to other factors. The 95% confidence interval of [-0.549, -0.352] is reasonably tight and does not cross zero, and the p-value of 3.04×10⁻¹⁴ confirms this correlation is highly statistically significant given the large population (N = 3,232) — making it extremely unlikely to be a chance finding. However, statistical significance should not be conflated with practical or economic significance. Critically, the Granger causality tests show no significant predictive directionality in either direction (X→Y: F = 0.313, p = 0.576; Y→X: F = 0.119, p = 0.731), meaning that past values of trading volume do not help predict future exchange rates, and vice versa. This strongly suggests the correlation reflects a shared response to common underlying forces rather than any direct causal mechanism.
Patterns, Clusters, and Outliers
The sample points reveal considerable scatter around the regression line, consistent with the moderate r value. A few notable structural features emerge. There appears to be a loose clustering of observations in the mid-volume range (roughly 350–550 million shares) with exchange rates spanning the full 1.25–1.51 range, suggesting high variability even at typical volume levels. Several potential outliers are visible at the extremes: the minimum volume observation (≈105.7M shares at 1.44) sits far left of the main cluster and may represent holiday-shortened or low-liquidity trading days, while the maximum volume observation (≈704.2M shares at 1.34) anchors the high-volume, lower-exchange-rate region. The Y-axis range is notably compressed (1.25–1.51), meaning what appear as large vertical deviations represent only ~0.26 EUR/USD in absolute terms — visually amplifying the scatter. No strong non-linear curvature is immediately apparent, though the wide dispersion suggests a linear model may be an oversimplification.
Confounding Factors and Caveats
Several important caveats apply to this analysis. First, 2009 was a structurally anomalous year: it encompassed post-Lehman crisis recovery, unprecedented Federal Reserve intervention, and extreme risk-sentiment swings — all of which simultaneously drove both equity volumes and currency movements, creating a classic spurious correlation through common causation. Risk-off periods drove both high equity selling volume and dollar strengthening (safe-haven demand), while risk-on periods saw lower volumes and a weaker dollar, which could mechanically generate the observed negative correlation without any direct link between the variables. Second, the datasets appear to have axis labels swapped in the metadata (Tape A Shares is described on the Y-axis but labeled as a USD/EUR exchange rate dataset, and vice versa) — this should be verified before drawing firm conclusions. Third, day-of-week effects, Federal Reserve announcements, and macroeconomic data releases are uncontrolled confounders that could drive both variables simultaneously on specific dates.
Actionable Insights and Further Investigation
Given the absence of Granger causality, practitioners should not attempt to use lagged equity volume as a predictor of EUR/USD rates (or vice versa) in any trading or forecasting model without substantially more evidence. For further investigation, the most productive next steps would include: (1) introducing explicit macroeconomic controls — particularly VIX (fear index), Fed funds rate decisions, and economic surprise indices — to test whether the correlation persists after accounting for shared risk-sentiment drivers; (2) extending the time series beyond 2009 to determine whether this relationship is crisis-specific or a persistent structural feature; (3) decomposing volume by trade type (institutional vs. retail, buy-initiated vs. sell-initiated) to identify whether specific volume components carry more signal; and (4) conducting rolling-window correlation analysis to examine whether the relationship strengthens or breaks down across different phases of the year (crisis vs. recovery). The current finding is statistically robust but economically ambiguous — further structural modeling is warranted before any causal interpretation is adopted.
X dataset: Cboe U.S. Equities Historical Market Volume Data 2009
Y dataset: US Dollar to Euro Exchange Rate
Part of experiment: Daily - Cboe U.S. Equities Historical Market Volume Data 2009 vs US Dollar to Euro Exchange Rate