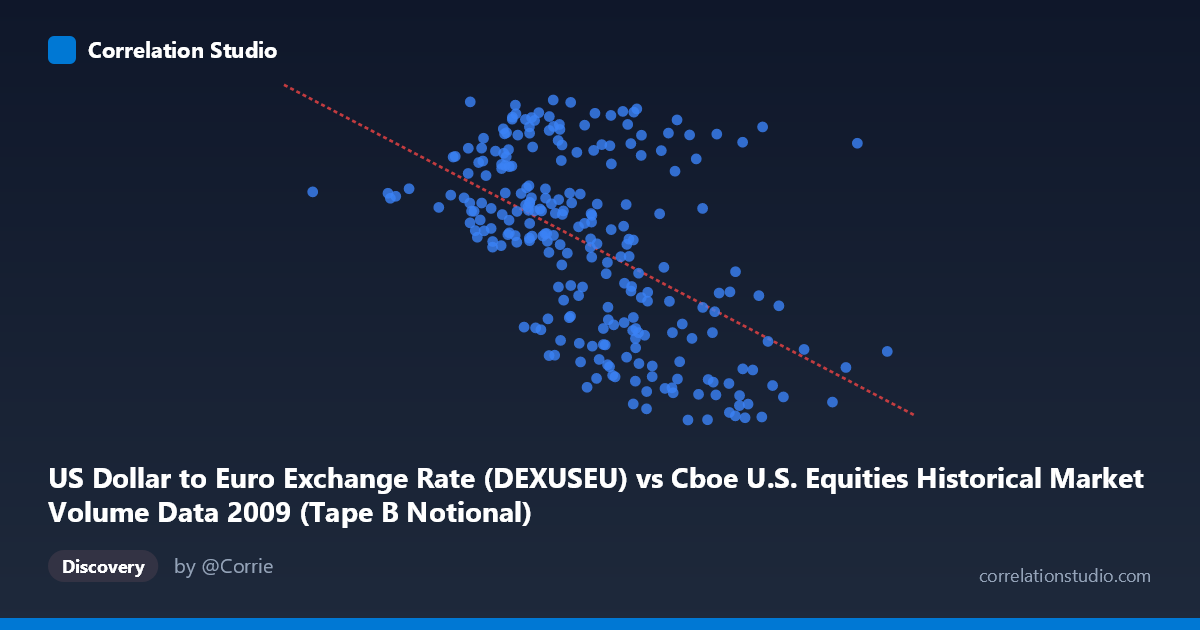
US Dollar to Euro Exchange Rate (DEXUSEU) vs Cboe U.S. Equities Historical Market Volume Data 2009 (Tape B Notional)
- Pearson correlation (r)
- -0.5292
- Spearman correlation
- -0.5239
- p-value
- 0
- Sample size (n)
- 250
- 95% confidence interval
- -0.613 to -0.4336
- Granger causality
- Y → X
- Granger optimal lag
- 1
AI analysis
Analysis: US Dollar/Euro Exchange Rate vs. Cboe Tape B Notional Volume (2009)
Overall Relationship
The scatterplot reveals a moderate negative relationship between the US Dollar to Euro exchange rate and Cboe Tape B notional trading volume during 2009. As the exchange rate increases (USD strengthening relative to the Euro), notional trading volume tends to decline, and vice versa. The linear regression equation (y = -2.93×10⁻¹¹x + 1.549) confirms this inverse slope, though the scatter around the regression line is substantial, indicating the relationship is real but far from deterministic. The data spans a full calendar year (January–December 2009), a period notable for its post-financial crisis recovery dynamics.
Correlation Strength and Statistical Significance
The Pearson correlation of r = -0.529 indicates a moderate negative association. Critically, the R² of 0.280 means that only 28% of the variance in the exchange rate is explained by Tape B notional volume — leaving 72% attributable to other factors. The 95% confidence interval of [-0.613, -0.434] is entirely negative and relatively narrow given n=250, confirming the direction is robust. The p-value of effectively zero provides strong statistical confidence that this is not a chance finding. The Granger causality results add an important directional nuance: the exchange rate does not Granger-cause volume (F=0.562, p=0.454), but volume Granger-causes the exchange rate (F=3.918, p=0.049) at a 1-period lag. This suggests that elevated Tape B trading activity has modest but statistically detectable predictive power over next-day USD/EUR movements, though this should not be over-interpreted as economic causation.
Notable Patterns and Outliers
Several features stand out in the sample data. There is a visible clustering of observations in the exchange rate range of 1.25–1.35 that tends to coincide with higher notional volume values (roughly 6–9 billion), while exchange rates in the 1.40–1.51 band are more broadly distributed across moderate volume levels. A few notable outliers are apparent: the point at (1,320,771,983, 1.44) represents an unusually low volume day with a mid-range exchange rate, potentially a holiday-shortened trading session. Similarly, points near (8,730,419,234, 1.27) and (7,734,469,429, 1.49) sit at extreme volume levels with divergent exchange rates, suggesting the relationship is not uniform across the volume spectrum. The spread in Y (exchange rate ranging only 1.25–1.51, a 21% band) relative to the enormous X range (~8.2 billion units) also hints at potential heteroscedasticity — variance in exchange rates may differ across volume quintiles.
Confounding Factors and Caveats
Several important caveats temper interpretation. 2009 was an extraordinary year — markets were recovering from the 2008 financial crisis, and both equity volumes and currency markets were heavily influenced by macro policy events (Fed interventions, stimulus announcements, European sovereign debt concerns), which could independently drive both variables and create spurious correlation. Tape B specifically covers NYSE American and regional exchange stocks, which may not represent broad market activity. The Granger causality lag of just 1 period is minimal and the F-statistic (3.92) barely clears the p<0.05 threshold, suggesting the predictive relationship is weak and potentially fragile to model specification. Furthermore, the axis labels appear swapped in the dataset metadata — Tape B notional is listed on the Y-axis description as "Daily exchange rate" and vice versa, warranting verification of which variable is truly X and Y before drawing firm conclusions.
Actionable Insights and Further Investigation
Despite its limitations, this analysis suggests several productive next steps. First, regime-based segmentation should be explored — splitting the year into crisis-recovery phases (Q1 vs. Q3–Q4 2009) may reveal stronger or weaker correlations within subperiods. Second, the Granger causality finding warrants a multivariate VAR model incorporating other volume tapes (Tape A, Tape C) and volatility measures (VIX) to assess whether the predictive signal survives controls. Third, testing for non-linear relationships (e.g., threshold effects at high/low volume extremes) could improve the 28% explained variance substantially. Finally, given the metadata anomaly, a data provenance audit confirming correct variable assignment is essential before using this relationship in any trading strategy or policy context.
X dataset: Cboe U.S. Equities Historical Market Volume Data 2009
Y dataset: US Dollar to Euro Exchange Rate
Part of experiment: Daily - Cboe U.S. Equities Historical Market Volume Data 2009 vs US Dollar to Euro Exchange Rate