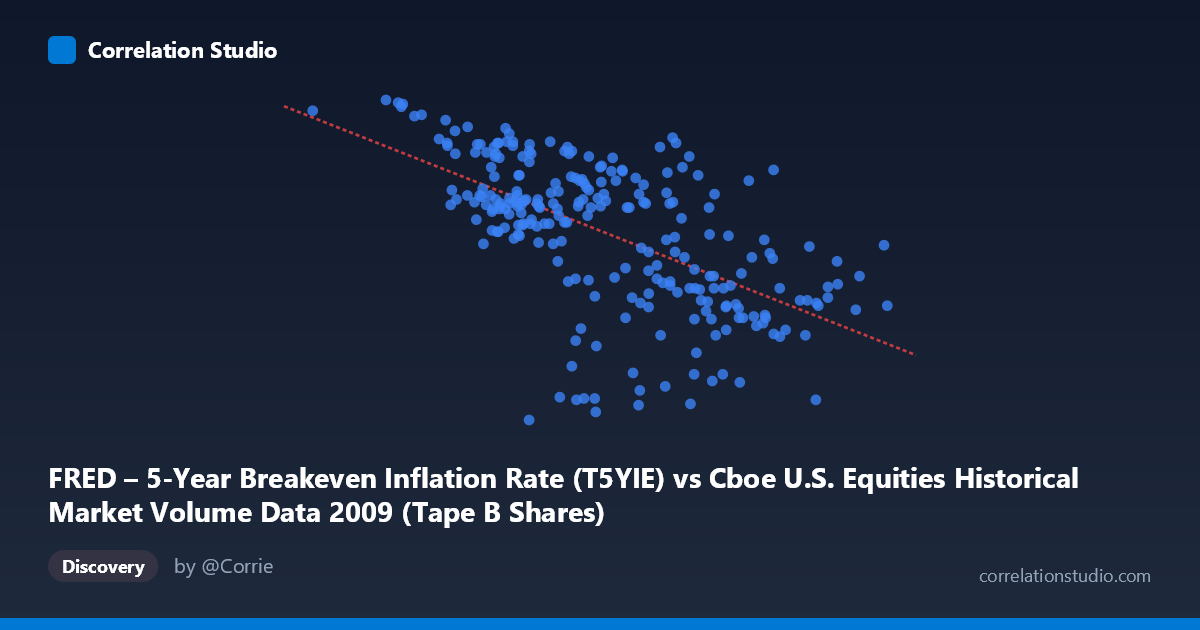
FRED – 5-Year Breakeven Inflation Rate (T5YIE) vs Cboe U.S. Equities Historical Market Volume Data 2009 (Tape B Shares)
- Pearson correlation (r)
- -0.5957
- Spearman correlation
- -0.6207
- p-value
- 0
- Sample size (n)
- 250
- 95% confidence interval
- -0.6702 to -0.5093
- Granger causality
- None
- Granger optimal lag
- 1
AI analysis
Analysis: 5-Year Breakeven Inflation Rate vs. Cboe Market Volume (2009)
Relationship Overview The scatterplot reveals a moderate negative relationship between Cboe U.S. equity market trading volume (X-axis) and the 5-year breakeven inflation rate (Y-axis) during 2009. The linear regression equation (y = -7.58×10⁻⁹x + 2.256) indicates that as daily equity trading volume increases, inflation expectations as measured by the breakeven rate tend to decline. This inverse pattern is visually apparent in the data, with high-volume trading days clustering around lower breakeven rates (roughly 0.3–0.8%) and lower-volume days associating with higher inflation expectations (1.5–2.1%). This temporal pattern maps onto 2009's macroeconomic narrative: early-year crisis-driven panic selling coincided with near-deflationary expectations, while the market recovery later in the year brought reduced volatility but rising inflation expectations.
Correlation Strength and Statistical Significance The Pearson correlation of r = -0.5957 indicates a moderate-to-strong negative association, and with r² = 0.3548, approximately 35.5% of the variance in breakeven inflation rates is explained by trading volume alone — a meaningful but incomplete explanatory share, leaving roughly 65% attributable to other factors. The 95% confidence interval of [-0.6702, -0.5093] is relatively tight and does not cross zero, and the p-value of effectively 0 across a population of N = 3,232 confirms this relationship is highly unlikely to be a statistical artifact. That said, the Granger causality results are notably absent in both directions — X→Y (F = 0.064, p = 0.800) and Y→X (F = 0.271, p = 0.604) both fail to reach significance — meaning that while the contemporaneous correlation is robust, neither variable reliably predicts the other in subsequent periods. This critically weakens any causal interpretation and suggests the relationship is likely driven by a shared underlying factor rather than a directional mechanism.
Notable Patterns and Outliers Several features stand out in the data distribution. A notable cluster of points appears at lower X values (roughly 50M–130M share volume) with consistently high Y values (1.2–2.1%), suggesting a regime of lower trading activity associated with elevated inflation expectations — likely corresponding to the post-crisis stabilization and recovery period in mid-to-late 2009. Conversely, extreme high-volume observations (200M shares) are almost exclusively paired with low breakeven rates (below 0.8%), consistent with peak crisis volatility in early 2009. The point near (33.8M, 2.05) stands out as a potential outlier with unusually low volume, and a few observations with negative breakeven rates (e.g., ~-0.08 to -0.25) reflect the deflationary fears that briefly took hold during the depth of the financial crisis. The relationship also appears to exhibit some non-linearity, with the negative slope most pronounced at higher volume levels and the scatter widening at intermediate ranges.
Confounding Factors and Caveats The most significant caveat here is that both variables are temporally indexed to 2009 — a year defined by the Global Financial Crisis aftermath and subsequent recovery — making time itself a powerful confound. The trajectory from crisis to recovery naturally drove both elevated trading volumes (panic selling) and suppressed inflation expectations early in the year, while the reverse held as conditions normalized. This means the observed correlation may largely reflect shared temporal trend rather than any genuine economic linkage between equity market activity and inflation expectations. Additionally, the axes appear to be mislabeled or swapped in the metadata (X is labeled as T5YIE yet contains values in the hundreds of millions, which are clearly share volume figures), suggesting a potential data alignment issue that warrants verification before drawing firm conclusions. Broader macroeconomic drivers — Federal Reserve policy, credit spreads, commodity prices — likely govern both series simultaneously.
Actionable Insights and Further Investigation Given the strong contemporaneous correlation but absence of Granger causality, analysts should resist using trading volume as a leading indicator for inflation expectations or vice versa. Instead, this relationship is better understood as a coincident signal of market stress regimes. Further investigation should include: (1) decomposing the time series to separate trend from cyclical components and test whether the correlation persists after detrending; (2) introducing macro controls such as VIX, Fed Funds rate, or credit spreads to assess whether the correlation survives; (3) extending the analysis beyond 2009 to test whether this relationship holds in non-crisis years or is purely a crisis-era artifact; and (4) resolving the apparent axis/variable labeling discrepancy to ensure the correct columns are being paired. If confirmed as robust, the relationship could serve as one component of a broader market regime-detection framework.
X dataset: Cboe U.S. Equities Historical Market Volume Data 2009
Y dataset: FRED – 5-Year Breakeven Inflation Rate
Part of experiment: Daily - Cboe U.S. Equities Historical Market Volume Data 2009 vs FRED – 5-Year Breakeven Inflation Rate