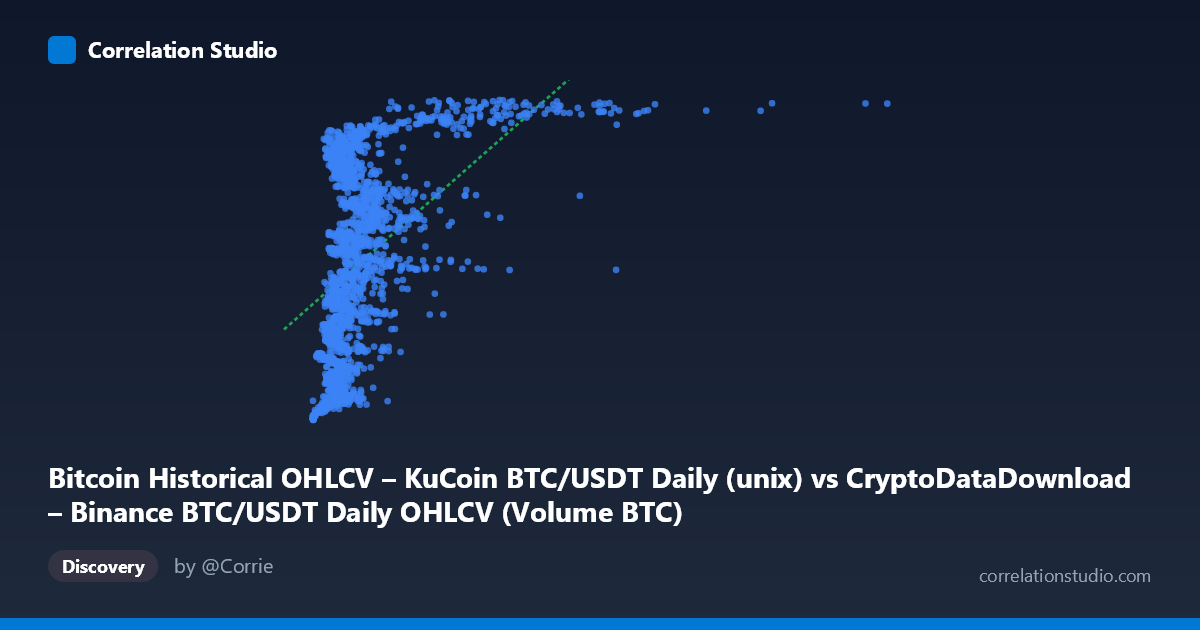
Bitcoin Historical OHLCV – KuCoin BTC/USDT Daily (unix) vs CryptoDataDownload – Binance BTC/USDT Daily OHLCV (Volume BTC)
- Pearson correlation (r)
- 0.511
- Spearman correlation
- 0.5777
- p-value
- 0
- Sample size (n)
- 1861
- 95% confidence interval
- 0.4766 to 0.5438
- Granger causality
- None
- Granger optimal lag
- 10
AI analysis
Analysis: Bitcoin Volume vs. Timestamp Relationship
1. What the Visualization Reveals
This scatterplot is somewhat unusual in that the "X" variable is actually a Unix timestamp (mislabeled as OHLCV volume in the metadata) rather than a true independent variable like price or volume. Effectively, this chart plots trading volume against time, showing how BTC/USDT volume on the exchange evolved from October 2017 through November 2022. The data reveals a general upward drift in the X-values (volume) over the time period, but with substantial scatter and clustering at lower values punctuated by occasional large spikes.
2. Strength, Direction, and Statistical Interpretation
The correlation coefficient (r = 0.511) indicates a moderate positive relationship, with r² = 0.261 meaning only about 26% of the variance in Y is explained by X — leaving roughly 74% attributable to other factors or noise. The 95% confidence interval [0.477, 0.544] is fairly narrow and does not cross zero, and the p-value of ~0 confirms this correlation is highly statistically significant given the large sample (n=1,861). However, statistical significance here reflects sample size more than practical predictive power — r² of 0.26 is a weak-to-moderate explanatory relationship, not strong enough for reliable forecasting.
Critically, the Granger causality test shows no significant predictive direction in either direction (X→Y: p=0.63; Y→X: p=0.17). This means that despite the moderate contemporaneous correlation, neither variable helps predict future values of the other in a time-series sense. This is an important distinction: correlation without Granger causality suggests the relationship may be driven by a shared underlying trend (e.g., both increasing over the market's maturation) rather than one variable mechanically influencing the other.
3. Notable Patterns and Outliers
The sample points show clear clustering at lower X-values (under 100,000) across most of the time range, with a distinct cluster of high-X outliers (200,000–380,000) concentrated in the later timestamps (2022, particularly mid-to-late 2022). This suggests a volume spike or regime change in 2022 — possibly linked to major market events (e.g., the FTX collapse in November 2022, or broader crypto market volatility that year). The relationship also appears heteroskedastic: variance in volume increases substantially in later periods, consistent with growing market activity and volatility rather than a clean linear trend. This non-uniform spread violates a key assumption of simple linear regression, meaning the reported R² likely overstates the reliability of the linear model uniformly across the time range.
4. Confounding Factors and Caveats
Several caveats apply. First, treating time as an "X variable" conflates trend and seasonality effects — Bitcoin volume didn't increase linearly but rather in discrete jumps tied to bull/bear cycles (2017-18 mania, 2020-21 bull run, 2022 crash). Second, cross-exchange data (Binance vs. KuCoin) may introduce reporting inconsistencies, wash trading, or differing liquidity dynamics that are not "real" economic relationships. Third, the linear regression (y = 334.98x + 1.566e9) is a crude approximation of what is likely a non-linear, regime-dependent process — market volume is known to cluster in volatility regimes (GARCH-like behavior), not follow a straight line.
5. Suggestions for Further Investigation
Given the lack of Granger causality, this relationship should not be used for predictive trading models. Instead, analysts should: (1) segment the data by market regime (bull/bear/crash periods) and re-run correlations within each to check for regime-specific relationships; (2) apply log-transformation to volume data, which is typically right-skewed, before regression; (3) investigate the 2022 high-volume cluster specifically to determine if it's driven by a single event or sustained structural change; and (4) test correlation with actual price or volatility (rather than time) as the X-variable to uncover more economically meaningful drivers of volume.
X dataset: CryptoDataDownload – Binance BTC/USDT Daily OHLCV
Y dataset: Bitcoin Historical OHLCV – KuCoin BTC/USDT Daily
Part of experiment: Bitcoin - CryptoDataDownload – Binance BTC/USDT Daily OHLCV vs Bitcoin Historical OHLCV – KuCoin BTC/USDT Daily