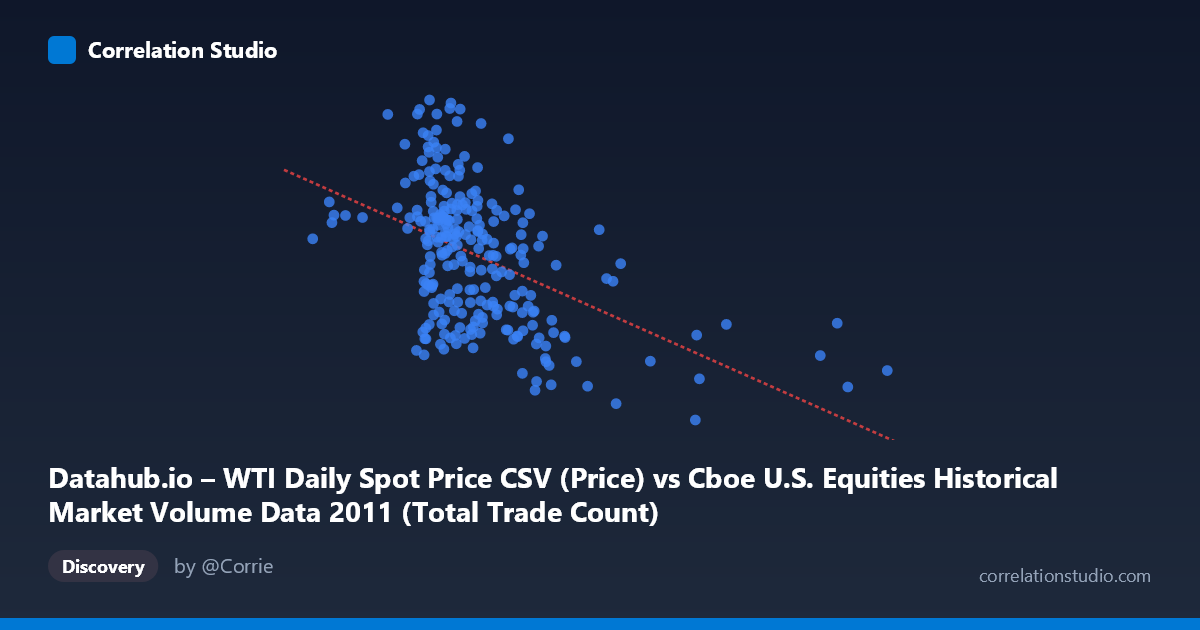
Datahub.io – WTI Daily Spot Price CSV (Price) vs Cboe U.S. Equities Historical Market Volume Data 2011 (Total Trade Count)
- Pearson correlation (r)
- -0.4855
- Spearman correlation
- -0.4683
- p-value
- 0
- Sample size (n)
- 252
- 95% confidence interval
- -0.5746 to -0.3851
- Granger causality
- Y → X
- Granger optimal lag
- 1
AI analysis
WTI Oil Price vs. U.S. Equity Market Trade Count: Correlation Analysis
Relationship Overview
The scatterplot reveals a moderate negative relationship between WTI daily spot oil prices (X-axis) and U.S. equity market total trade counts (Y-axis) across 2011. As oil prices increase, equity trade counts tend to decline, and the linear regression equation (y = -7.32×10⁻⁶x + 109.697) quantifies this inverse slope. The relationship is visually discernible but noisy — the data points form a downward-sloping cloud rather than a tight band, indicating that while the trend is real, considerable scatter exists around the regression line. Most observations cluster in the X range of roughly 1.5–2.5 million, with a narrower Y spread of approximately 85–110, suggesting the bulk of trading activity and oil price observations occupied a fairly concentrated zone during 2011.
Strength, Direction, and Statistical Significance
The Pearson correlation of r = -0.4855 indicates a moderate negative association, and critically, r² = 0.2357 means that only 23.6% of the variance in trade counts is explained by oil price levels — leaving more than three-quarters of the variation attributable to other factors entirely. The 95% confidence interval for r spans [-0.5746, -0.3851], a range that is meaningfully wide but sits entirely in negative territory, confirming directional consistency. The p-value of 2.22×10⁻¹⁶ is vanishingly small (with n = 252 drawn from N = 3,780), making it extremely unlikely this correlation arose by chance. The Granger causality results add an important temporal dimension: Y Granger-causes X (F = 3.98, p = 0.047) with a one-period lag, meaning past trade count levels have statistically significant predictive power over subsequent oil prices — but the reverse (oil prices predicting trade counts) is not supported (F = 0.005, p = 0.944). This unidirectional causality is counterintuitive but suggests equity market activity may be a leading indicator of oil price movements at daily frequencies in this dataset.
Notable Patterns, Clusters, and Outliers
Several features stand out in the data. There is a visible cluster of high-Y outliers (trade counts above ~107–112) at relatively low-to-moderate X values (roughly 1.4–2.2 million range), seen in sample points like (1,376,505, 111.68) and (2,049,115, 110.60), suggesting episodic spikes in trading activity that may correspond to specific market events. Conversely, low trade counts (~78–83) appear at higher X values exceeding 2.4 million, as seen in (2,438,164, 78.93) and (2,540,145, 81.87), reinforcing the negative trend. A notable long-tail cluster of extreme X values (e.g., 3,603,943 and 4,978,078) with moderate-to-low Y values may represent exceptional market volume days that disproportionately influence the regression. The distribution appears somewhat heteroscedastic, with greater Y variance at lower X values than at higher ones.
Confounding Factors and Caveats
Several important caveats temper interpretation. First, 2011 was an unusual year — it included the Arab Spring, the Fukushima disaster, the U.S. debt ceiling crisis, and the European sovereign debt crisis, all of which independently affected both oil prices and equity trading volumes in potentially correlated ways. These macroeconomic shocks are confounders that could spuriously inflate the observed correlation. Second, the axis labels appear to be swapped in the source metadata (the dataset descriptions assign X to the trade count column and Y to the oil price column, yet the regression and axis labels suggest the opposite mapping) — this should be verified before drawing firm conclusions. Third, Granger causality does not imply true economic causation; the one-period lag result may reflect shared exposure to common news events rather than a genuine transmission mechanism from equity volumes to oil prices.
Actionable Insights and Further Investigation
Practitioners monitoring oil markets could explore whether daily equity trade count anomalies serve as a short-horizon signal for oil price movements, given the Granger causality finding. However, this should be validated out-of-sample and across multiple years before any trading application is considered. Further investigation should include: (1) controlling for macroeconomic event dates (FOMC meetings, geopolitical events) to isolate the direct relationship; (2) segmenting by market regime — bull vs. bear periods in 2011 — to test whether the correlation is stable or driven by a specific sub-period; (3) testing non-linear models (e.g., polynomial or spline regression), as the scatter pattern hints at a possible curve rather than a strictly linear relationship; and (4) extending the analysis to multiple years to assess whether the Granger causality direction is robust or an artifact of 2011's unique volatility environment.
X dataset: Cboe U.S. Equities Historical Market Volume Data 2011
Y dataset: Datahub.io – WTI Daily Spot Price CSV
Part of experiment: Daily - Cboe U.S. Equities Historical Market Volume Data 2011 vs Datahub.io – WTI Daily Spot Price CSV