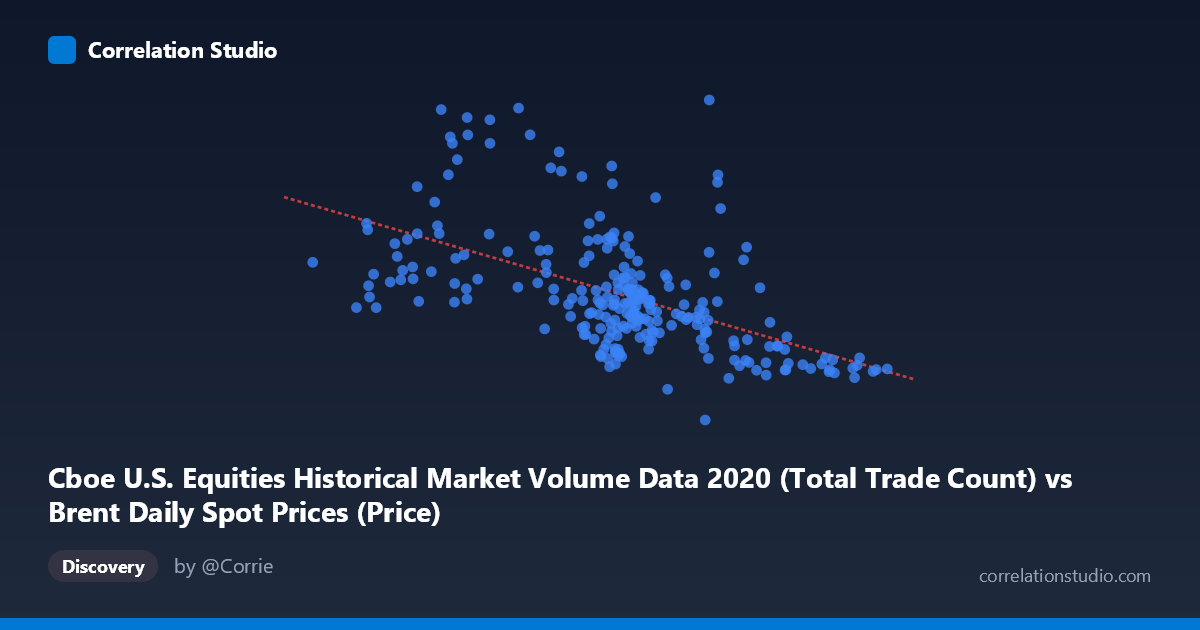
Cboe U.S. Equities Historical Market Volume Data 2020 (Total Trade Count) vs Brent Daily Spot Prices (Price)
- Pearson correlation (r)
- -0.5445
- Spearman correlation
- -0.5903
- p-value
- 0
- Sample size (n)
- 250
- 95% confidence interval
- -0.6263 to -0.4509
- Granger causality
- None
- Granger optimal lag
- 10
AI analysis
Scatterplot Analysis: Brent Crude Oil Prices vs. U.S. Equity Trade Count (2020)
Relationship Overview
The scatterplot reveals a moderate negative relationship between U.S. equity total trade count (X) and Brent crude oil spot prices (Y) across the 2020 trading year. The linear regression equation (y = −42,089.3x + 5,268,680) indicates that as daily equity trade counts increase, Brent crude prices tend to decline. This inverse relationship is visually apparent in the data cloud, which tilts downward from left to right — lower trade counts cluster around higher oil price levels, while higher trade counts are associated with lower price readings. The relationship is intuitive in a broad economic stress narrative: periods of market panic or uncertainty in 2020 (COVID-19 driven) simultaneously drove surging equity trade volumes and collapsing oil demand expectations.
Correlation Strength and Statistical Interpretation
The Pearson correlation of r = −0.5445 reflects a moderate negative association, but the explained variance tells a more sobering story: r² = 0.2965, meaning only ~29.6% of the variance in Brent crude prices is explained by equity trade count. The remaining ~70% of price variability is driven by other factors entirely. The 95% confidence interval of [−0.6263, −0.4509] is notably tight, a function of the large sample (n = 250 paired observations from N = 4,254), and the p-value of effectively zero confirms this correlation is highly statistically significant — it is very unlikely to be a chance artifact. However, statistical significance here should not be conflated with practical or causal significance. Critically, the Granger causality tests found no significant temporal predictive relationship in either direction (X→Y: F = 0.63, p = 0.79; Y→X: F = 0.51, p = 0.88), meaning trade count does not help forecast future oil prices, and oil prices do not help forecast future trade counts. Despite the meaningful correlation, neither variable temporally "leads" the other in a predictively useful way.
Notable Patterns, Clusters, and Outliers
Several features stand out in the data cloud. There is a visible concentration of points in the mid-range of X (roughly 38–50 trade count units) spanning a wide Y range (~2.4M–4.5M price range), suggesting high variability in oil prices even when trade volumes are moderate — consistent with the low r². At the lower end of the X-axis (X < 30), oil prices are predominantly elevated (above 3.5M), consistent with early 2020 pre-crash conditions. The upper X range (X 55) shows prices clustering in a lower band (~2.3M–2.8M), aligning with the COVID-driven oil price crash period. One notable outlier appears near (35.33, 5,713,160) — a data point with a relatively moderate trade count but an exceptionally high oil price, well above the regression line, which warrants individual investigation. Similarly, a cluster of low-price observations (below ~2.4M) at moderate-to-high trade volumes forms a distinct lower-right grouping.
Confounding Factors and Caveats
This correlation is almost certainly driven heavily by a shared common cause: the COVID-19 pandemic shock of 2020, rather than any direct mechanistic link between equity trading volume and oil prices. Market disruptions in March–April 2020 simultaneously caused oil prices to collapse (including the historic negative WTI event) and equity markets to experience unprecedented volatility and volume surges as retail and institutional investors repositioned. This is a textbook spurious correlation mediated by a confounding third variable (pandemic economic shock). Additionally, the dataset mismatch noted in the metadata — the X column appears sourced from a Brent price file and Y from a volume file — suggests possible data assembly issues that should be verified before drawing conclusions. The time series nature of both variables also introduces autocorrelation, which can inflate apparent correlation strength and undermine standard significance tests even with large samples.
Actionable Insights and Further Investigation
Given that Granger causality is absent, practitioners should not use equity trade count as a leading indicator for Brent crude pricing or vice versa in any trading or risk model. The correlation appears to be a 2020-specific, pandemic-driven artifact rather than a structural relationship, and it should be tested against other years (2018, 2019, 2021) to assess persistence — if the negative correlation disappears in normal market conditions, it confirms the confound hypothesis. Further analysis should decompose the data by time period (pre-COVID, crash, recovery) to test whether the relationship strengthens or reverses across regimes. Incorporating a broader multivariate model — including VIX, economic indicators, OPEC decisions, and USD strength — would help quantify what fraction of the unexplained ~70% variance can be recovered. Finally, the outlier near (35.33, 5,713,160) should be examined for data entry errors or a specific market event that could provide qualitative context.
X dataset: Brent Daily Spot Prices
Y dataset: Cboe U.S. Equities Historical Market Volume Data 2020
Part of experiment: Daily - Brent Daily Spot Prices vs Cboe U.S. Equities Historical Market Volume Data 2020