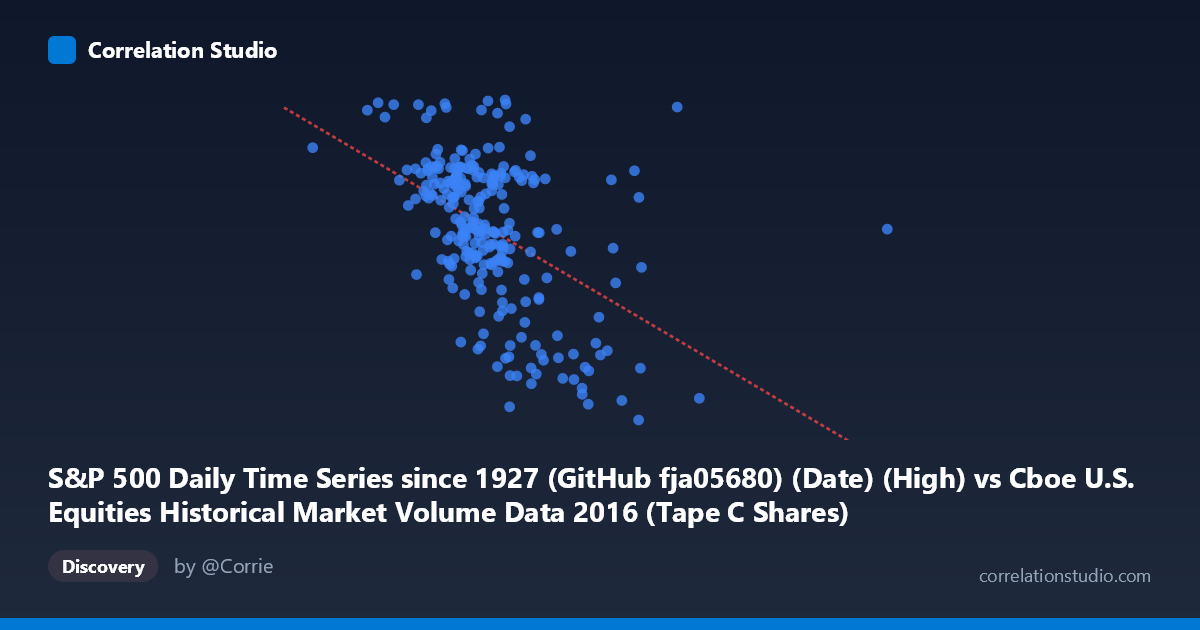
S&P 500 Daily Time Series since 1927 (GitHub fja05680) (Date) (High) vs Cboe U.S. Equities Historical Market Volume Data 2016 (Tape C Shares)
- Pearson correlation (r)
- -0.479
- Spearman correlation
- -0.4837
- p-value
- 0
- Sample size (n)
- 252
- 95% confidence interval
- -0.5689 to -0.3778
- Granger causality
- None
- Granger optimal lag
- 4
AI analysis
Scatterplot Analysis: S&P 500 Daily High vs. Cboe Tape C Share Volume (2016)
Relationship Overview The scatterplot reveals a negative relationship between the S&P 500 daily high price (X-axis) and Cboe Tape C share volume (Y-axis) across 252 trading days in 2016. As the S&P 500 reached higher price levels, Tape C share volumes tended to be lower, and conversely, lower index levels were associated with elevated trading volumes. This inverse pattern is visually discernible as a downward-sloping cloud of points, consistent with the fitted regression line y = -1.728×10⁻⁶x + 2333.04. The relationship is meaningful but far from deterministic — the data points show considerable scatter around the regression line, indicating that many other forces are at work beyond index price level alone.
Correlation Strength, Direction, and Causality The Pearson correlation of r = -0.479 indicates a moderate negative association. However, the coefficient of determination r² = 0.2295 is the more informative metric: it tells us that the S&P 500 daily high explains only about 22.9% of the variance in Tape C share volume, meaning roughly 77% of volume variability is driven by other factors entirely. The 95% confidence interval of [-0.569, -0.378] is comfortably negative and does not cross zero, and the p-value of 6.66×10⁻¹⁶ confirms the correlation is highly statistically significant — virtually impossible to attribute to chance given n = 252. That said, significance does not imply strong explanatory power. Critically, the Granger causality tests find no significant temporal predictive direction in either direction (X→Y: F = 0.90, p = 0.46; Y→X: F = 1.48, p = 0.21), meaning that past S&P 500 highs do not reliably predict future Tape C volumes, nor do past volumes predict future index highs. The relationship appears contemporaneous rather than predictive.
Patterns, Clusters, and Outliers The bulk of observations cluster in a relatively tight band — S&P 500 highs between approximately 110M–155M (in the reported units) and Tape C volumes between roughly 2,050–2,200 — suggesting this was the "normal" operating regime for most of 2016. Several notable outliers are visible at the extremes: a cluster of points at lower X values (below ~105M) paired with notably high Y values (~2,200–2,277), consistent with high-volatility, high-volume periods early in 2016 when markets were under stress. Conversely, points at higher X values (above ~160–175M) correspond to unusually low volumes (~1,850–1,950), likely reflecting the calmer, trend-following bull market environment in the latter part of the year. One point near (99.8M, 2,271) stands out as a potential high-leverage outlier that may be disproportionately influencing the regression slope.
Confounding Factors and Caveats This correlation almost certainly reflects a shared dependence on market volatility rather than a direct causal mechanism. In periods of market stress (lower index levels), both retail and institutional investors trade more actively, inflating volume; in calmer bull trends, volume naturally subsides — a well-documented phenomenon in market microstructure. Seasonality is another confound: 2016 included distinct macro events (Brexit in June, the U.S. election in November) that simultaneously drove index drawdowns and volume spikes. The dataset spans only one calendar year, so the relationship may not generalize — in secular bull markets or different volatility regimes, the sign or magnitude could differ. Additionally, Tape C specifically captures Nasdaq-listed securities, which may behave differently from the broader S&P 500 index, introducing a compositional mismatch between the two variables.
Actionable Insights and Further Investigation Practitioners should not use S&P 500 price levels as a standalone predictor of Tape C volume given the weak explained variance and absent Granger causality. A more productive approach would incorporate implied volatility (VIX) as a mediating variable, which likely explains a far greater portion of volume variance and may reveal that the apparent price-volume relationship is largely a proxy for volatility. It would also be worthwhile to decompose Tape C volume by trade size or participant type (retail vs. institutional) to test whether the relationship is driven by a specific market segment. Extending the analysis across multiple years would test whether this negative relationship is a structural feature of equity markets or an artifact of 2016's particular macro narrative. Finally, exploring non-linear models (e.g., piecewise regression around volatility regimes) could improve explanatory power substantially beyond the current 23%.
X dataset: Cboe U.S. Equities Historical Market Volume Data 2016
Y dataset: S&P 500 Daily Time Series since 1927 (GitHub fja05680) (Date)
Part of experiment: Daily - Cboe U.S. Equities Historical Market Volume Data 2016 vs S&P 500 Daily Time Series since 1927 (GitHub fja05680) (Date)