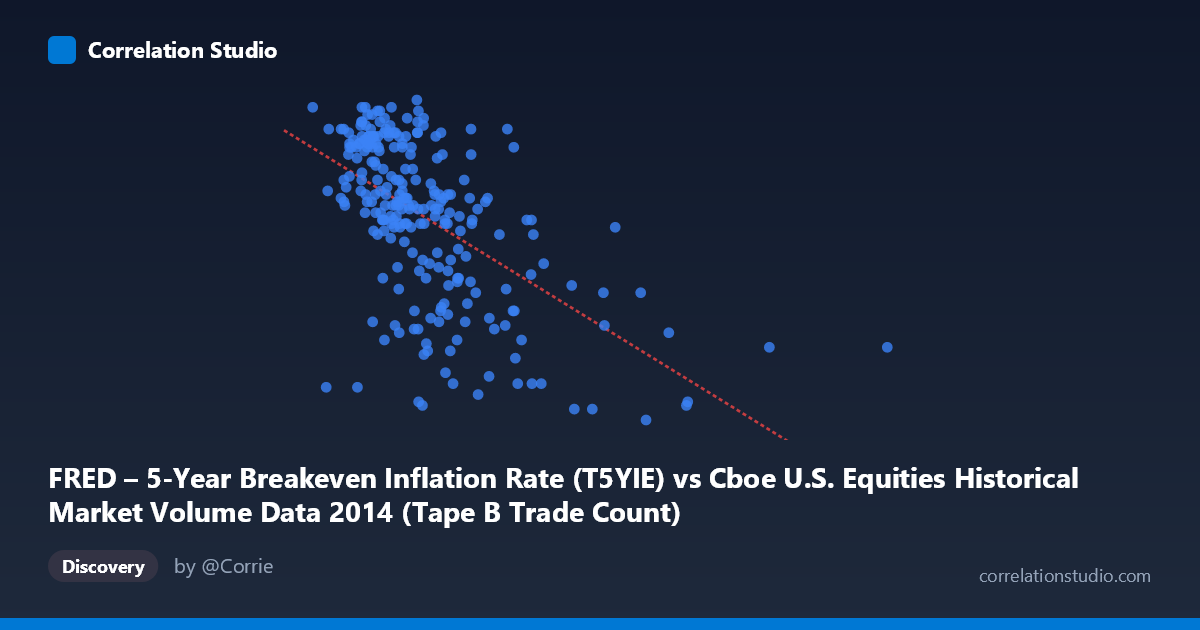
FRED – 5-Year Breakeven Inflation Rate (T5YIE) vs Cboe U.S. Equities Historical Market Volume Data 2014 (Tape B Trade Count)
- Pearson correlation (r)
- -0.5753
- Spearman correlation
- -0.591
- p-value
- 0
- Sample size (n)
- 250
- 95% confidence interval
- -0.6528 to -0.486
- Granger causality
- None
- Granger optimal lag
- 1
AI analysis
Scatterplot Analysis: 5-Year Breakeven Inflation Rate vs. Cboe Tape B Trade Count (2014)
Relationship Overview
The scatterplot reveals a moderate negative relationship between Cboe U.S. Equities Tape B trade count (X-axis) and the 5-Year Breakeven Inflation Rate (Y-axis) across 2014. As daily equity trade volume increases, inflation expectations tend to decline. The linear regression equation (y = -1.72474E⁻⁰⁶x + 2.10869) confirms this inverse slope, with the fitted line descending from approximately 2.03–2.05 at lower trade volumes (~110,000–160,000) down toward 1.17–1.37 at extreme high-volume days (~480,000–676,000). The bulk of observations cluster tightly in the lower-left region, reflecting that most trading days fall within a more typical volume range, while the inflation rate during this period oscillated meaningfully between roughly 1.17 and 2.05.
Correlation Strength, Direction, and Uncertainty
The Pearson correlation of r = -0.5753 indicates a moderate-to-strong negative association, statistically robust given the sample size of 250 paired observations drawn from a population of 3,686. The coefficient of determination r² = 0.3310 means that only 33.1% of the variance in the breakeven inflation rate is explained by trade volume — substantial, but leaving two-thirds of variation unexplained by this single variable alone. The 95% confidence interval of [-0.6528, -0.4860] is relatively tight and does not cross zero, reinforcing that the negative direction is reliable rather than a sampling artifact. The p-value of effectively 0 confirms statistical significance at any conventional threshold. However, the Granger causality results are unambiguous in their null finding: neither direction (X→Y: F=0.0000, p=0.9995; Y→X: F=0.3282, p=0.5673) shows meaningful temporal predictive power at a one-period lag. This is a critical caveat — the correlation exists contemporaneously, but neither variable reliably predicts the other the following day, ruling out a simple lead-lag causal mechanism.
Notable Patterns, Clusters, and Outliers
The data exhibit a pronounced right-skewed distribution along the X-axis, with the vast majority of observations compressed between approximately 110,000 and 350,000 trades, and a sparse but influential tail extending to ~676,000. Several points warrant particular attention: the extreme outliers at (479,569, 1.22), (478,251, 1.21), and (675,899, 1.37) sit far from the main cluster and exert disproportionate leverage on the regression slope — these likely correspond to specific high-volatility market events in 2014 (such as geopolitical shocks or Federal Reserve announcements) that simultaneously drove heavy trading and depressed inflation expectations. Within the main cluster, there is notable vertical spread even at similar X values (e.g., trade counts near 200,000 correspond to inflation rates ranging from ~1.42 to ~2.03), indicating substantial unexplained variance consistent with the r² of 0.33. There is also a subtle visual suggestion of a non-linear, concave relationship — the rate of decline in inflation expectations appears steeper moving from low to moderate volumes than from moderate to high volumes.
Confounding Factors and Interpretive Caveats
This correlation almost certainly reflects common-cause confounding rather than a direct mechanism between trade volume and inflation expectations. Both variables are plausibly driven by shared macroeconomic forces: periods of heightened market uncertainty, risk-off sentiment, or deflationary shocks in 2014 (e.g., oil price collapse in H2 2014, geopolitical tensions in Ukraine/Russia) would simultaneously suppress inflation breakevens and elevate equity trading activity as investors repositioned. The axis labels appear swapped relative to typical analytical convention — the FRED breakeven rate is plotted on Y despite being labeled as the X column, and vice versa, which should be confirmed before drawing directional conclusions. Additionally, Tape B specifically covers NYSE American and regional exchange volume, which may not fully represent broader market activity. The single-year time window (2014) limits generalizability, particularly given the unusual macro environment of that year including oil price shocks and Fed tapering completion. Serial autocorrelation in daily financial time series also inflates effective sample size estimates, meaning the true statistical uncertainty may be wider than reported.
Actionable Insights and Further Investigation
Given that the correlation is real but causally ambiguous, several follow-up analyses are warranted. First, test whether the relationship holds across multiple years or is idiosyncratic to 2014's macro regime — the oil shock and Fed tapering make this year particularly unusual. Second, conduct a proper outlier sensitivity analysis by re-running the regression excluding the three extreme high-volume days to quantify their leverage on the r value. Third, introduce multivariate controls — particularly VIX (volatility index), WTI crude oil prices, and Fed funds futures — to isolate whether any residual relationship between trade volume and inflation expectations survives after accounting for shared macro drivers. Fourth, test longer Granger causality lags (5, 10, 22 trading days) since one-period lag may be too short to detect any information transmission between these markets. Finally, segmenting the data by quarter may reveal whether the negative relationship strengthens during the H2 2014 oil shock period versus the relatively calm H1, providing insight into whether the correlation is regime-dependent.
X dataset: Cboe U.S. Equities Historical Market Volume Data 2014
Y dataset: FRED – 5-Year Breakeven Inflation Rate
Part of experiment: Daily - Cboe U.S. Equities Historical Market Volume Data 2014 vs FRED – 5-Year Breakeven Inflation Rate