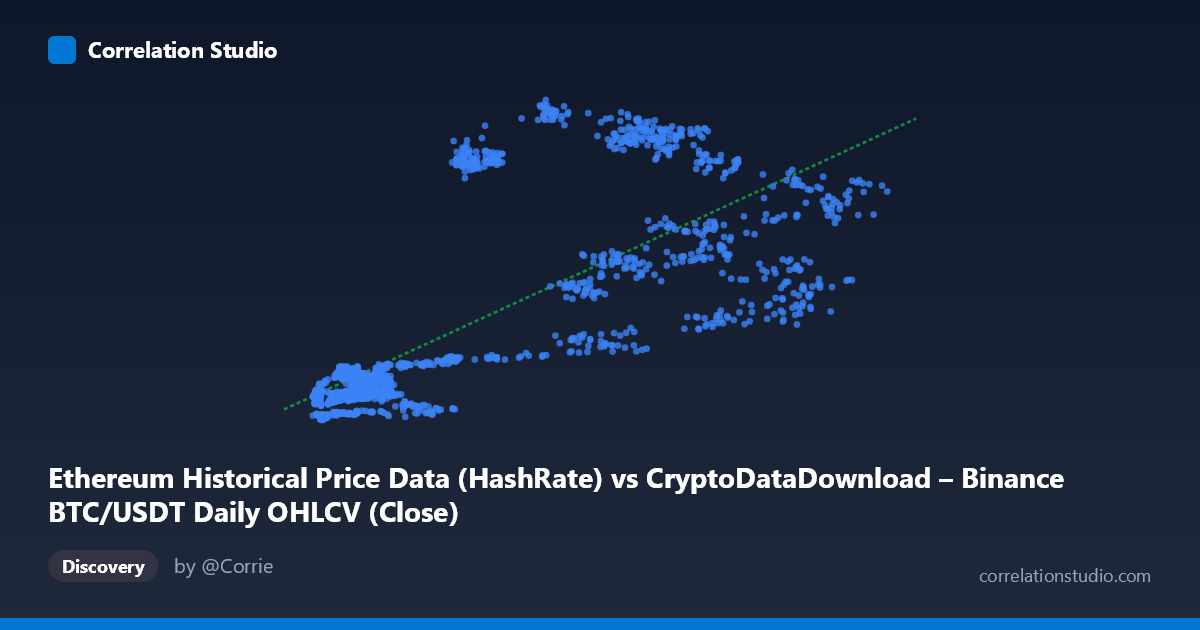
Ethereum Historical Price Data (HashRate) vs CryptoDataDownload – Binance BTC/USDT Daily OHLCV (Close)
- Pearson correlation (r)
- 0.7489
- Spearman correlation
- 0.7536
- p-value
- 0
- Sample size (n)
- 1855
- 95% confidence interval
- 0.7282 to 0.7682
- Granger causality
- None
- Granger optimal lag
- 1
- Time coverage
- 2017-08-17 to 2022-09-14
AI analysis
Analysis of BTC/ETH Price Relationship
1. Overview of the Relationship
The scatterplot depicts a positive association between two cryptocurrency price series (labeled here as X and Y, though the metadata suggests both are drawn from BTC/USDT and Ethereum price histories). As X increases, Y tends to increase as well, though the relationship is far from a tight linear band — there's substantial vertical scatter at nearly every X value, particularly in the mid-to-upper X range (20,000–50,000), where Y values span roughly 270 to 1,065, a nearly 4x spread for similar X inputs.
2. Strength, Direction, and Statistical Confidence
The correlation coefficient (r = 0.749) indicates a moderately strong positive linear relationship, with r² = 0.561 meaning only about 56% of the variance in Y is explained by X — leaving nearly 44% attributable to other factors, noise, or nonlinear dynamics. The 95% CI [0.728, 0.768] is tight, and the p-value is effectively zero, so we can be highly confident this correlation is not due to chance in this sample. However, statistical significance here reflects the very large n (1,855) rather than a deterministic relationship — practically, X is a useful but incomplete predictor of Y.
Critically, the Granger causality tests show no significant predictive direction in either direction (X→Y: p=0.297; Y→X: p=0.530). This means that past values of one series do not meaningfully improve forecasts of the other beyond what the series' own history provides. The contemporaneous correlation is real, but it does not imply that movements in one variable lead the other temporally — they likely both respond to a shared underlying driver (e.g., broader crypto market sentiment, BTC dominance effects, or macro liquidity conditions) rather than one causing the other.
3. Notable Patterns and Outliers
Several structural features stand out: - Low-X cluster (X < 15,000): Tightly packed with low Y values (100–250), showing a fairly linear, low-variance relationship — likely representing earlier/bear-market periods. - High-X fan-out (X 18,000): Points diverge dramatically. Notable outliers include (18,970.79, 939.71), (21,254.67, 873.68), and (19,811.66, 895.64) — high Y values at moderate X — contrasted with (58,202.01, 483.42) and (54,340.89, 438.26), where high X pairs with comparatively low Y. This suggests a regime shift or bubble-like period where Y spiked independently of X. - This fan pattern hints at non-linear or regime-dependent behavior, possibly two overlapping market cycles (e.g., 2021 bull run vs. 2022 correction) with different X-Y relationships.
4. Confounding Factors and Caveats
Both variables are cryptocurrency prices, which are known to be highly cross-correlated due to shared market sentiment, exchange liquidity, macro risk-on/risk-off cycles, and correlated trading volumes — not necessarily direct causal linkage. Time itself is a major confound: both series likely trend upward over the 2017–2022 window due to overall market growth, which can inflate correlation (spurious trend correlation) even absent a direct relationship. The metadata also shows some inconsistency/mislabeling between "HashRate" and "Close" price columns, so the actual variables being compared should be verified before drawing firm conclusions.
5. Suggested Next Steps
- De-trend or use returns/log-returns instead of raw price levels to test whether the correlation holds after removing shared upward drift — this is essential for crypto price data. - Segment by market regime (bull vs. bear, or by year) to check if the relationship is stable or driven by specific periods (e.g., the 2021 rally cluster). - Investigate a shared third factor (BTC dominance index, USD liquidity/DXY, overall crypto market cap) that may explain the co-movement better than a direct X-Y link. - Given the lack of Granger causality, avoid using one series to forecast the other in a trading strategy; instead, treat them as contemporaneously co-moving assets driven by common market forces.
X dataset: CryptoDataDownload – Binance BTC/USDT Daily OHLCV
Y dataset: Ethereum Historical Price Data
Part of experiment: Bitcoin - CryptoDataDownload – Binance BTC/USDT Daily OHLCV vs Ethereum Historical Price Data