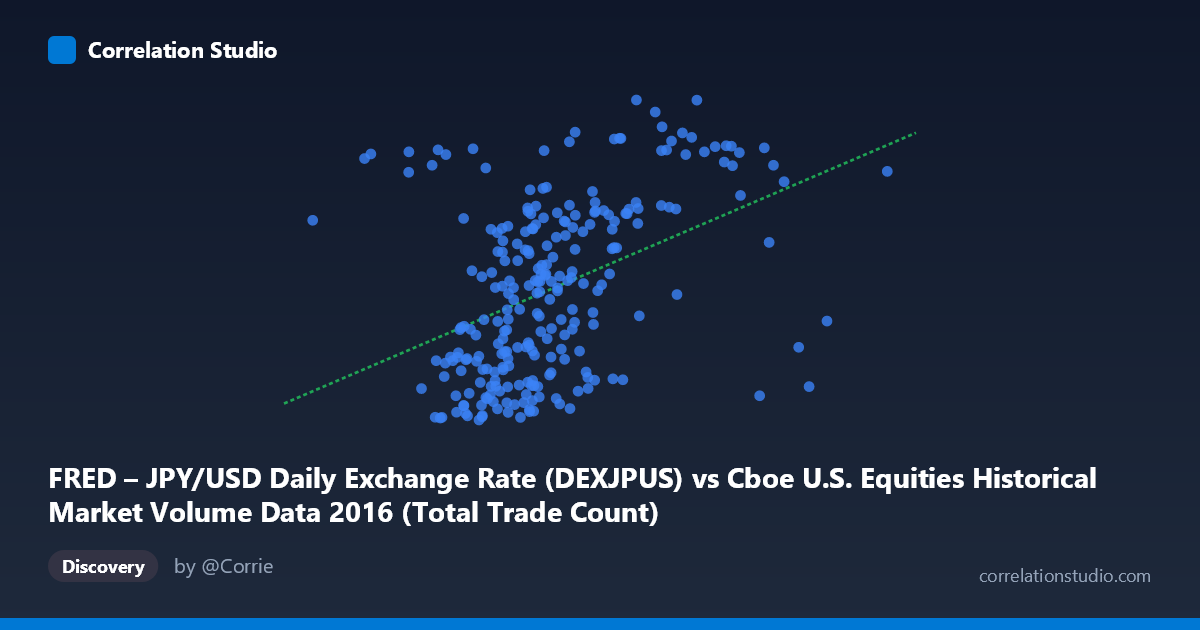
FRED – JPY/USD Daily Exchange Rate (DEXJPUS) vs Cboe U.S. Equities Historical Market Volume Data 2016 (Total Trade Count)
- Pearson correlation (r)
- 0.4168
- Spearman correlation
- 0.4611
- p-value
- 0
- Sample size (n)
- 250
- 95% confidence interval
- 0.3086 to 0.5142
- Granger causality
- Y → X
- Granger optimal lag
- 1
AI analysis
Analysis: JPY/USD Exchange Rate vs. U.S. Equities Total Trade Count (2016)
Relationship Overview The scatterplot reveals a modest positive relationship between the JPY/USD daily exchange rate (X-axis) and U.S. equities total trade count (Y-axis) across 2016. The linear regression equation (y = 4.52321E-06x + 97.6851) confirms a positive slope, meaning that as the exchange rate value increases — indicating a weaker yen relative to the dollar — trade counts on U.S. equity exchanges tend to be somewhat higher. While the directional trend is discernible, the scatter around the regression line is substantial, suggesting the relationship is real but far from deterministic. The data points cluster predominantly in the X range of roughly 1.9M to 3.0M with Y values between 100 and 115, indicating that most trading days fall within a relatively bounded zone, with notable exceptions on both axes.
Correlation Strength and Statistical Significance The Pearson correlation of r = 0.4168 indicates a weak-to-moderate positive association. Critically, the R² value of 0.1737 means that only 17.4% of the variance in trade count is explained by the JPY/USD exchange rate — leaving over 82% of variation attributable to other factors entirely. The 95% confidence interval for r of [0.3086, 0.5142] is meaningfully above zero throughout, and the p-value of 6.347E-12 confirms this relationship is highly statistically significant given n = 250 and a population of N = 3,622. However, statistical significance here should not be conflated with practical significance; the effect size remains modest. The Granger causality results add an important temporal dimension: Y Granger-causes X (F = 4.6613, p = 0.0318) at a one-period lag, while X does not Granger-cause Y (F = 0.1857, p = 0.6669). This unidirectional finding suggests that past U.S. equity trade counts carry predictive information about subsequent JPY/USD movements, but not vice versa — a counterintuitive but meaningful asymmetry worth investigating further.
Notable Patterns, Clusters, and Outliers Several features stand out visually. The bulk of observations cluster between X values of roughly 1.8M–3.2M and Y values of 100–115, forming a moderately dispersed core cloud. There are at least two prominent outliers on the high-X end — observations near X = 3.96M and X = 4.14M — that appear to break away from the main cluster with relatively moderate Y values (~104–107), suggesting these high-volume trading days did not correspond to particularly elevated trade counts, potentially pulling the regression fit. On the high-Y end, a point near (2,955,314, 121.06) stands out as an extreme trade count observation. The distribution also shows mild heteroscedasticity, with variance in Y appearing somewhat larger at mid-range X values than at the extremes, which could subtly affect the reliability of standard linear regression assumptions.
Confounding Factors and Interpretive Caveats Several important caveats apply. First, this is a within-year (2016) analysis, a period that included significant macro events — including the U.S. presidential election in November and Brexit aftershocks — that independently drove both currency volatility and equity market volume, creating potential spurious correlation driven by shared response to common shocks. Second, the axis labeling warrants careful attention: the dataset descriptions appear to have swapped axis assignments (the FRED JPY/USD series is plotted on X, while "Total Trade Count" is on Y), which is correctly reflected in the Granger causality interpretation but could cause confusion. Third, Granger causality establishes temporal predictive precedence, not true causation — the finding that trade counts predict exchange rate movements may reflect latent common drivers (e.g., risk-on/risk-off sentiment) rather than any direct mechanism. Finally, daily aggregation may obscure intraday dynamics that are more mechanistically relevant.
Actionable Insights and Further Investigation Despite the modest R², the statistically robust correlation and the Granger causality finding offer genuine leads for further inquiry. Analysts should control for key 2016 macro events (Brexit vote, U.S. election, BOJ policy shifts) to test whether the correlation holds after removing event-driven co-movement. Investigating whether the Granger causality signal persists at longer lags (2–5 periods) would help assess whether trade count leads exchange rates over more tradeable horizons. Segmenting the data by exchange venue or trade type (e.g., retail vs. institutional) may reveal whether the relationship is driven by a specific market segment. Additionally, incorporating VIX or implied volatility measures as control variables could disentangle whether risk sentiment is the true common driver underlying both series, providing a cleaner test of any direct currency-volume linkage.
X dataset: Cboe U.S. Equities Historical Market Volume Data 2016
Y dataset: FRED – JPY/USD Daily Exchange Rate
Part of experiment: Daily - Cboe U.S. Equities Historical Market Volume Data 2016 vs FRED – JPY/USD Daily Exchange Rate