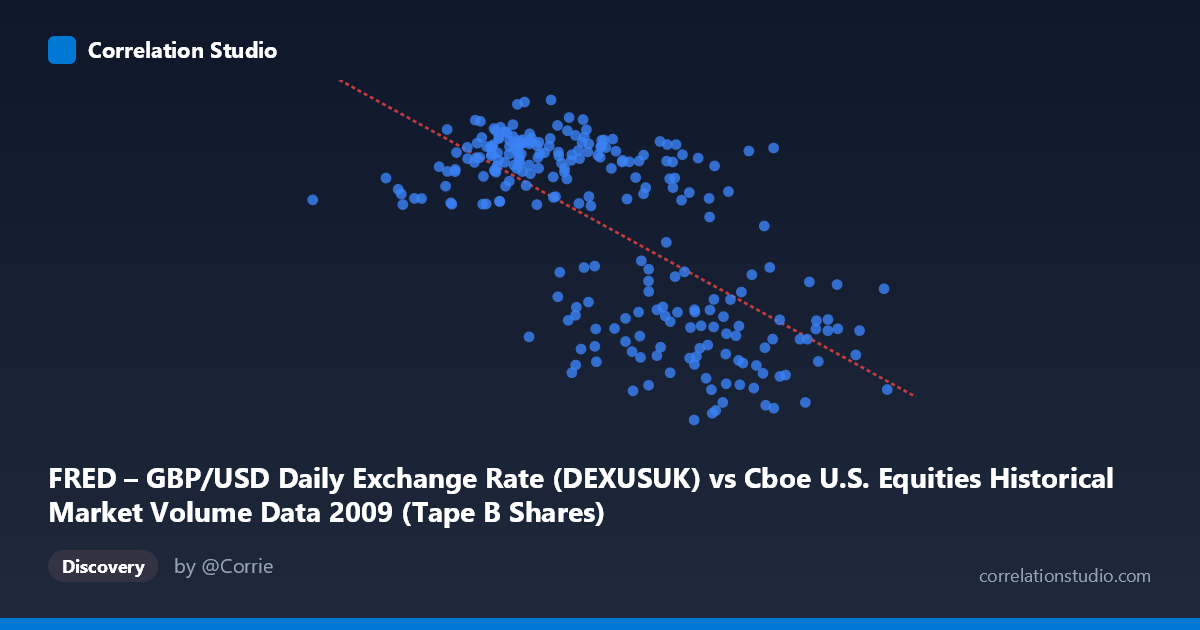
FRED – GBP/USD Daily Exchange Rate (DEXUSUK) vs Cboe U.S. Equities Historical Market Volume Data 2009 (Tape B Shares)
- Pearson correlation (r)
- -0.669
- Spearman correlation
- -0.6115
- p-value
- 0
- Sample size (n)
- 250
- 95% confidence interval
- -0.7323 to -0.5943
- Granger causality
- None
- Granger optimal lag
- 1
AI analysis
Analysis: GBP/USD Exchange Rate vs. Cboe Tape B Share Volume (2009)
Relationship Overview The scatterplot reveals a moderate negative relationship between U.S. equity market volume (Tape B shares traded) and the GBP/USD exchange rate across 2009. As daily share volume increases, the pound sterling tends to weaken against the dollar (lower GBP/USD rate). The linear regression equation (y = -1.477×10⁻⁹x + 1.784) confirms this inverse slope, meaning each additional ~678 million shares traded is associated with approximately a one-cent decline in the GBP/USD rate. Visually, the data points fan across a recognizable downward-sloping band, though with considerable scatter, suggesting the relationship is real but far from deterministic.
Correlation Strength and Statistical Significance The Pearson r of -0.669 indicates a moderate-to-strong negative correlation, and with N=3,232 trading-day observations the p-value rounds to zero, making this statistically unambiguous. However, r² = 0.448 is the more important practical figure: only about 44.8% of the variance in GBP/USD is explained by Tape B volume, meaning the majority (55.2%) is driven by other forces entirely. The 95% confidence interval of [-0.732, -0.594] is reasonably tight, reinforcing confidence in the direction and approximate magnitude of the association. Critically, Granger causality is absent in both directions (X→Y: F=0.017, p=0.896; Y→X: F=0.151, p=0.698), meaning neither variable meaningfully predicts the future values of the other at a one-period lag. The relationship is contemporaneous and associative, not temporally predictive.
Patterns, Clusters, and Outliers Several notable features emerge from the sample points. At high volume levels (200 million shares), GBP/USD values cluster tightly in the 1.38–1.50 range, suggesting a ceiling effect where elevated market activity consistently coincides with a weaker pound. At lower volume levels (<120 million shares), GBP/USD values are more dispersed but tend to sit higher (1.59–1.67), indicating a stronger pound during quieter trading days. A few potential outliers stand out: the point near (33.8M shares, 1.59) represents an unusually low-volume day with a mid-range exchange rate, possibly a holiday-shortened session. The point near (254.5M shares, 1.50) sits at the far right of the x-axis but doesn't display an extreme y-value, suggesting diminishing returns in the relationship at very high volumes.
Confounding Factors and Caveats This correlation almost certainly reflects shared exposure to a common underlying driver rather than a direct causal mechanism. The year 2009 was defined by the aftermath of the global financial crisis — periods of acute market stress drove both surges in U.S. equity trading volume (panic selling, deleveraging) and significant dollar strengthening (flight-to-safety flows), which would naturally depress GBP/USD. This creates a classic confounding scenario where macroeconomic risk sentiment simultaneously elevates volume and suppresses the pound. Additionally, the axes appear swapped in labeling (the dataset notes describe X as the exchange rate source but label it as volume, and vice versa), which warrants verification before drawing firm conclusions. The analysis also covers only a single calendar year, limiting generalizability, and the Granger test at lag=1 day may miss longer-horizon predictive relationships.
Actionable Insights and Further Investigation The absence of Granger causality suggests this relationship should not be used for short-term trading signals — knowing today's volume does not help predict tomorrow's exchange rate, and vice versa. Instead, both variables likely serve as co-indicators of market risk regimes, making the correlation more useful for regime classification than directional forecasting. Recommended next steps include: (1) introducing a risk-sentiment proxy (e.g., VIX) as a control variable to test whether the correlation vanishes once crisis intensity is accounted for; (2) extending the time series across multiple years to determine whether the relationship persists outside crisis conditions; (3) testing longer Granger lags (5, 10, 22 trading days) to check for monthly-horizon predictability; and (4) segmenting the data by market regime (high-stress vs. calm periods) to see whether the correlation is driven entirely by a subset of observations during the peak crisis months of early 2009.
X dataset: Cboe U.S. Equities Historical Market Volume Data 2009
Y dataset: FRED – GBP/USD Daily Exchange Rate
Part of experiment: Daily - Cboe U.S. Equities Historical Market Volume Data 2009 vs FRED – GBP/USD Daily Exchange Rate