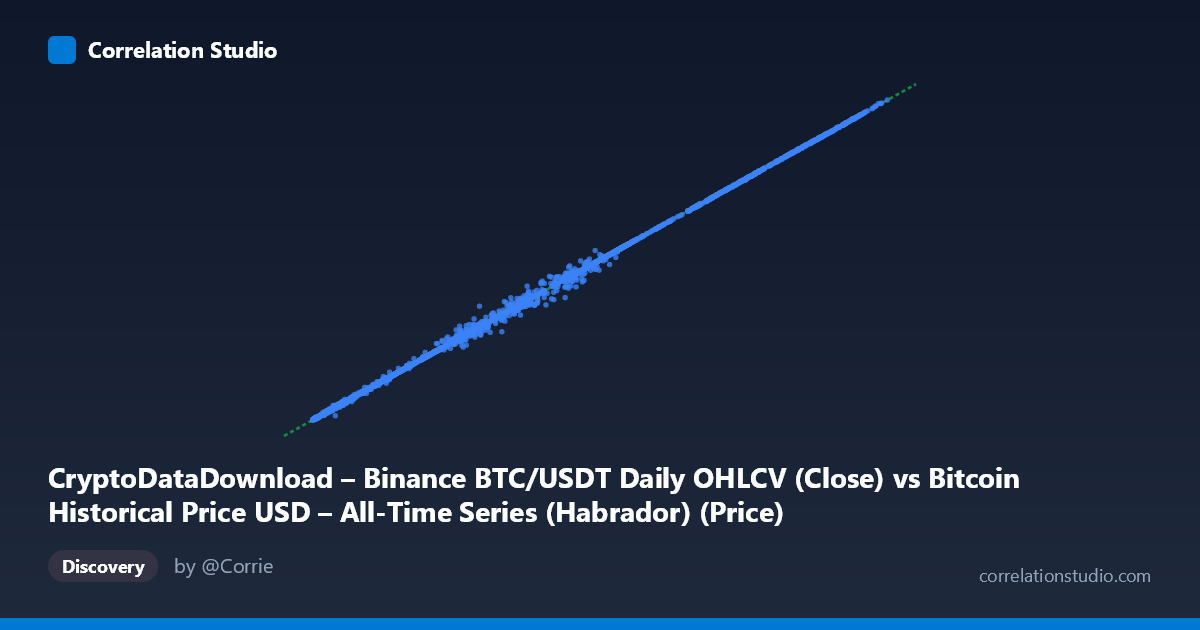
CryptoDataDownload – Binance BTC/USDT Daily OHLCV (Close) vs Bitcoin Historical Price USD – All-Time Series (Habrador) (Price)
- Pearson correlation (r)
- 0.9998
- Spearman correlation
- 0.9997
- p-value
- 0
- Sample size (n)
- 3169
- 95% confidence interval
- 0.9997 to 0.9998
- Granger causality
- None
- Granger optimal lag
- 10
- Time coverage
- 2017-08-17 to 2026-04-28
AI analysis
Analysis: BTC/USDT Closing Price — CryptoDataDownload (Binance) vs. Habrador All-Time Series
1. What the Visualization Reveals
The scatterplot shows an almost perfectly linear relationship between two Bitcoin price series spanning from mid-2017 to early 2026. Points hug a diagonal line with slope ≈0.999 and intercept ≈28.47, indicating that for virtually every value of X, Y takes an almost identical value. This is the signature of two measurements of the same underlying quantity — daily BTC closing price — sourced from different providers (Binance direct feed vs. Habrador's aggregated historical dataset), rather than two genuinely independent economic variables.
2. Strength, Direction, and Statistical Confidence
The correlation is essentially maximal: r = 0.9998, r² = 0.9995, meaning 99.95% of the variance in one series is explained by the other. The 95% CI [0.9997, 0.9998] is extremely tight, and p = 0 confirms this is not a chance result even accounting for autocorrelation in time series. Practically, this means the two datasets are interchangeable for most analytical purposes — knowing one gives you the other with sub-1% error almost everywhere.
The Granger causality test is important context: neither direction shows significant predictive lead (X→Y: p=0.070; Y→X: p=0.063), both hovering just above the 0.05 threshold. This makes sense — these aren't two causally linked markets but two records of one price stream, likely both derived from Binance or highly synchronized exchanges. Any "predictive" lag structure reflects reporting/timestamp conventions, not economic causation.
3. Notable Patterns and Outliers
The scale itself is the dominant feature: values span from ~$3,200 to ~$124,700, a 39x range, reflecting Bitcoin's full boom-bust history (2017 peak, 2018-2020 bear market, 2021 and 2024-2025 bull runs). A few sample rows show meaningful divergence — e.g., (52173.87, 55025.59), (57284.92, 55996.93), (17954.86, 18655.67), (4287.81, 3932.44) — deviations of 3-5%, larger than the typical near-zero residual. These likely correspond to specific dates with data discontinuities: exchange outages, flash crashes/wicks, timezone/UTC cutoff mismatches between providers, or different treatment of stablecoin (USDT) vs. USD pricing during depeg events.
4. Confounding Factors and Caveats
Because both series measure the same asset, high r² is expected and uninformative about any causal or economic relationship — this is a data reconciliation exercise, not a discovery of correlated phenomena. Key caveats: (a) USDT-denominated vs. USD-denominated close prices can diverge during stablecoin depegs; (b) "daily close" timestamp conventions differ across data vendors (UTC midnight vs. exchange-local); (c) N=3,212 vs. n=3,169 paired points implies ~43 unmatched dates — check for gaps, holidays, or exchange downtime; (d) heavy heteroscedasticity is baked into price data (variance scales with price level), so raw r² may mask proportionally larger errors at high price levels.
5. Suggested Next Steps
Rather than treating this as a correlation study, use it as a data quality audit: compute residuals (Y − predicted Y) and flag/investigate the largest outliers by date to identify specific data errors or exchange anomalies. Convert to log-price or percentage-return space to check whether the near-perfect fit holds for volatility/returns, not just levels. Reconcile the 43 unmatched records. If the goal is genuinely causal/lead-lag analysis (e.g., price discovery across venues), better candidates would be comparing different exchanges (Binance vs. Coinbase vs. Kraken) or on-chain vs. exchange prices, where Granger causality tests would carry more economic meaning.
X dataset: Bitcoin Historical Price USD – All-Time Series (Habrador)
Y dataset: CryptoDataDownload – Binance BTC/USDT Daily OHLCV
Part of experiment: Bitcoin - Bitcoin Historical Price USD – All-Time Series (Habrador) vs CryptoDataDownload – Binance BTC/USDT Daily OHLCV