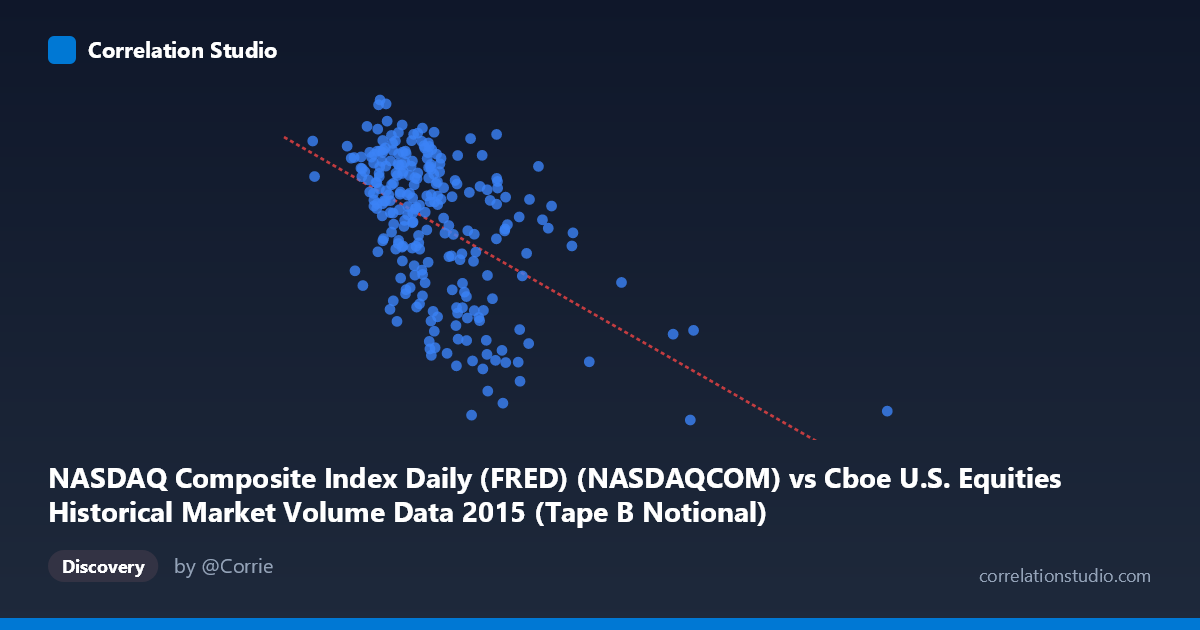
NASDAQ Composite Index Daily (FRED) (NASDAQCOM) vs Cboe U.S. Equities Historical Market Volume Data 2015 (Tape B Notional)
- Pearson correlation (r)
- -0.512
- Spearman correlation
- -0.4888
- p-value
- 0
- Sample size (n)
- 252
- 95% confidence interval
- -0.5977 to -0.4146
- Granger causality
- None
- Granger optimal lag
- 10
AI analysis
Analysis: NASDAQ Composite Index vs. Cboe Tape B Notional Volume (2015)
Relationship Overview The scatterplot reveals a moderate negative relationship between daily NASDAQ Composite Index values and Cboe Tape B notional trading volume throughout 2015. As the NASDAQ index climbed higher, Tape B notional volume tended to be lower, and conversely, periods of lower index values corresponded with elevated trading volumes. This inverse pattern is consistent with well-documented market behavior where heightened volatility and declining prices tend to drive increased trading activity, while steadily rising markets often see relatively subdued volume. The linear regression equation (y = -4.63×10⁻⁸x + 5198.49) confirms this negative slope, though the relationship is clearly not perfectly linear across the full range of the data.
Correlation Strength and Statistical Significance The Pearson correlation of r = -0.512 indicates a moderate negative association, but the more practically meaningful statistic is r² = 0.262 — meaning that NASDAQ index levels explain only about 26.2% of the variance in Tape B notional volume. This leaves roughly 74% of the variation attributable to other factors entirely. The 95% confidence interval of [-0.598, -0.415] is meaningfully narrow and sits entirely in negative territory, providing strong statistical confidence that the true population correlation is genuinely negative rather than a sampling artifact. The p-value of effectively zero, derived from a paired sample of n = 252 drawn from a population of N = 3,302, reinforces that this correlation is highly unlikely to be due to chance. However, statistical significance at this sample size should not be conflated with practical or causal significance — a relationship can be reliably detected without being large or actionable on its own.
Critically, the Granger causality results indicate no significant predictive directionality in either direction. Neither X→Y (F = 1.80, p = 0.061) nor Y→X (F = 0.79, p = 0.641) crosses the conventional significance threshold, even at the optimal lag of 10 periods. This means that, despite the meaningful contemporaneous correlation, past values of the NASDAQ index do not reliably predict future Tape B volume, and past volume does not reliably predict future index levels. The relationship appears to be co-occurring rather than causally sequential — both variables are likely responding simultaneously to common market drivers rather than one leading the other.
Notable Patterns, Clusters, and Outliers Several features stand out in the sampled data points. The bulk of observations cluster between roughly 3.5B–6.5B on the X-axis and 4,700–5,200 on the Y-axis, representing "normal" 2015 market conditions. However, there are notable high-volume outliers at the far right of the X-axis — observations around 12.5B–17.9B notional volume — paired with relatively depressed NASDAQ values in the 4,500–4,700 range. These almost certainly correspond to the August 2015 market correction, when the NASDAQ fell sharply and trading volumes surged dramatically. The point at approximately (12,491,974,395, 4,506) is particularly striking as the lowest NASDAQ value in the sample paired with one of the highest volume readings. This cluster of stress-period observations likely exerts disproportionate leverage on the regression line and may be inflating the magnitude of the overall correlation coefficient.
Confounding Factors and Caveats Several important caveats apply to this analysis. First, the August 2015 volatility episode represents a structural break in normal market conditions — if those outlier observations were removed, the correlation would almost certainly weaken substantially, suggesting the relationship may be driven more by a handful of extreme events than by a stable, persistent mechanism. Second, Tape B specifically covers NYSE American (AMEX) and regional exchange listings, not NASDAQ-listed stocks directly, which introduces a question of whether cross-market notional volume is the most theoretically appropriate comparison to the NASDAQ Composite. Third, both variables are subject to strong common drivers — macroeconomic news, Federal Reserve policy signals, and global risk sentiment — that could create spurious or inflated correlation without any direct link between the two series. Fourth, the data covers only a single calendar year (2015), limiting generalizability; the correlation structure in a low-volatility year like 2013 or a crisis year like 2008 could look dramatically different.
Actionable Insights and Further Investigation For practitioners, the most actionable finding is arguably the non-finding from Granger causality: neither the index nor volume consistently leads the other, which suggests that simple lag-based trading strategies using one to predict the other would not be reliable over this period. Further investigation should consider: (1) segmenting the analysis by excluding the August correction period to test whether the correlation holds in calmer conditions; (2) testing this relationship across multiple years to assess whether 2015 is representative or anomalous; (3) examining intraday data to see if short-horizon lead-lag relationships exist that daily aggregation obscures; and (4) introducing volatility measures (e.g., VIX) as a potential mediating or confounding variable, since implied volatility likely explains both elevated volume and depressed prices simultaneously. Finally, using a non-linear or regime-switching model may better capture the apparent threshold behavior where the relationship intensifies sharply during market stress events.
X dataset: Cboe U.S. Equities Historical Market Volume Data 2015
Y dataset: NASDAQ Composite Index Daily (FRED)
Part of experiment: Daily - Cboe U.S. Equities Historical Market Volume Data 2015 vs NASDAQ Composite Index Daily (FRED)