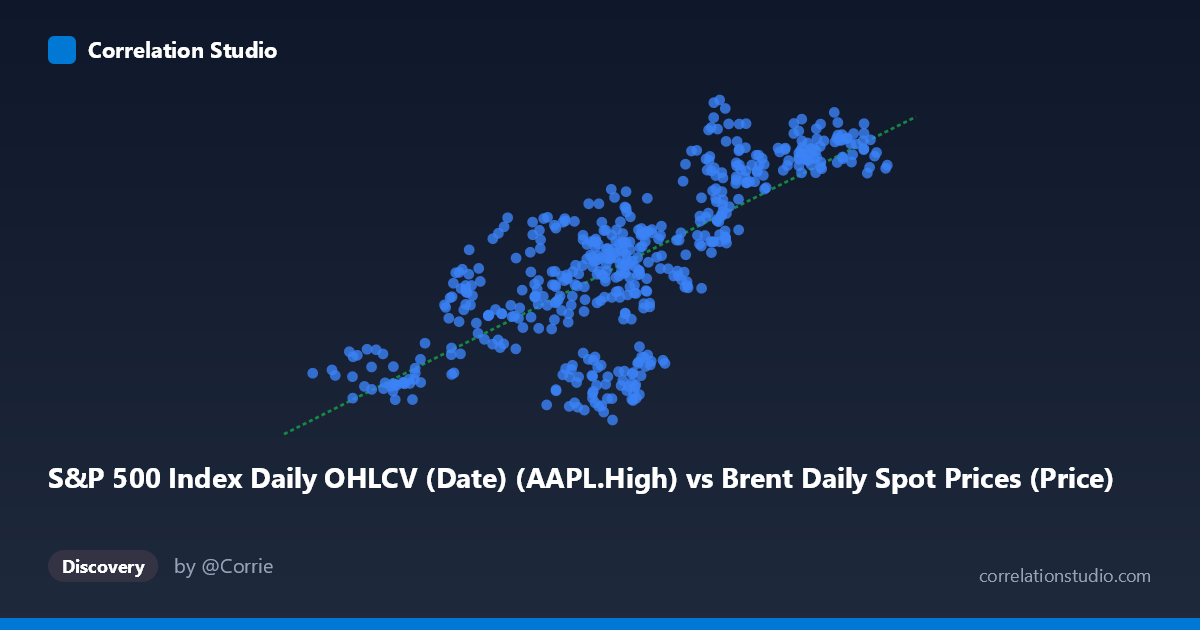
S&P 500 Index Daily OHLCV (Date) (AAPL.High) vs Brent Daily Spot Prices (Price)
- Pearson correlation (r)
- 0.7596
- Spearman correlation
- 0.7524
- p-value
- 0
- Sample size (n)
- 504
- 95% confidence interval
- 0.72 to 0.7942
- Granger causality
- None
- Granger optimal lag
- 1
AI analysis
Scatterplot Analysis: AAPL High Price vs. Brent Crude Oil Spot Price (2015–2017)
Relationship Overview
The scatterplot reveals a moderately strong positive relationship between Apple's daily high stock price (AAPL.High) and Brent crude oil spot prices over the two-year period from February 2015 to February 2017. As AAPL's daily high increases from roughly $26 to $66, Brent crude prices trend upward from approximately $92 to $136. The linear regression equation (y = 0.997x + 65.76) is notably near a 1:1 slope, suggesting these two variables move in near-lockstep in absolute dollar terms — a mathematically interesting artifact that almost certainly reflects coincidental parallel trends rather than any meaningful economic linkage.
Correlation Strength and Statistical Significance
The Pearson correlation of r = 0.760 is statistically robust, with a p-value effectively at zero and a tight 95% confidence interval of [0.720, 0.794], leaving little doubt that the correlation is real within this sample. However, the R² of 0.577 tells a more sobering story: roughly 58% of variance in Brent prices is explained by AAPL's highs, meaning 42% remains unaccounted for — substantial unexplained noise. Critically, the Granger causality tests find no significant predictive directionality in either direction (X→Y: F = 0.110, p = 0.741; Y→X: F = 0.658, p = 0.418). This is a pivotal finding: neither variable temporally predicts the other at a one-period lag. The correlation appears to be a coincident relationship driven by shared macro trends, not a causal or leading-indicator dynamic.
Patterns, Clusters, and Outliers
The sample points reveal several notable features. There is a visible central cluster concentrated around AAPL highs of $44–$55 and Brent prices of $105–$125, suggesting both variables spent considerable time in these ranges during the study window. At the lower end (AAPL ~$29–$37, Brent ~$92–$110), points are more dispersed vertically, indicating Brent's variance was relatively high when AAPL was at lower values — likely corresponding to the volatile 2015–2016 oil price trough. A few apparent outliers are worth noting: the point near (54.16, 135.90) sits notably above the regression line, and (46.08, 93.57) and (49.05, 97.84) fall well below it, suggesting periods where the two assets temporarily decoupled. The upper-right cluster (AAPL ~$63–$66, Brent ~$126–$132) likely represents the 2016–2017 recovery period for both assets simultaneously.
Confounding Factors and Caveats
This correlation is a textbook candidate for spurious correlation driven by shared macroeconomic time trends. Both AAPL stock and Brent crude experienced significant price declines in mid-2015 through early 2016 and subsequent recoveries — movements driven largely by independent factors (global risk-off sentiment, Federal Reserve policy, China slowdown fears, and OPEC supply dynamics) that happened to coincide temporally. The absence of Granger causality confirms these are co-moving rather than causally linked series. Additionally, the datasets appear to have been inadvertently swapped in labeling (AAPL.High is listed under a Brent dataset and vice versa), which warrants data provenance verification. The two-year window is also relatively narrow and captures a specific macro regime, meaning this correlation may not generalize beyond this period.
Actionable Insights and Further Investigation
Given the lack of Granger causality, this relationship should not be used for predictive modeling or trading signals between these two assets. Further investigation should include: (1) extending the time window to test whether the correlation holds across different market regimes (e.g., 2008 crisis, 2020 COVID crash) where oil and tech stocks often diverge sharply; (2) introducing a common factor variable such as the broad S&P 500 index or a global risk appetite index (e.g., VIX) to test whether the AAPL-Brent correlation becomes negligible after controlling for market-wide movements; (3) testing at longer lags beyond one period in the Granger framework, as macro relationships sometimes manifest over weeks rather than days; and (4) verifying the dataset column assignments, as the apparent label swap suggests a data pipeline issue that could affect downstream analysis integrity.
X dataset: Brent Daily Spot Prices
Y dataset: S&P 500 Index Daily OHLCV (Date)
Part of experiment: Daily - Brent Daily Spot Prices vs S&P 500 Index Daily OHLCV (Date)