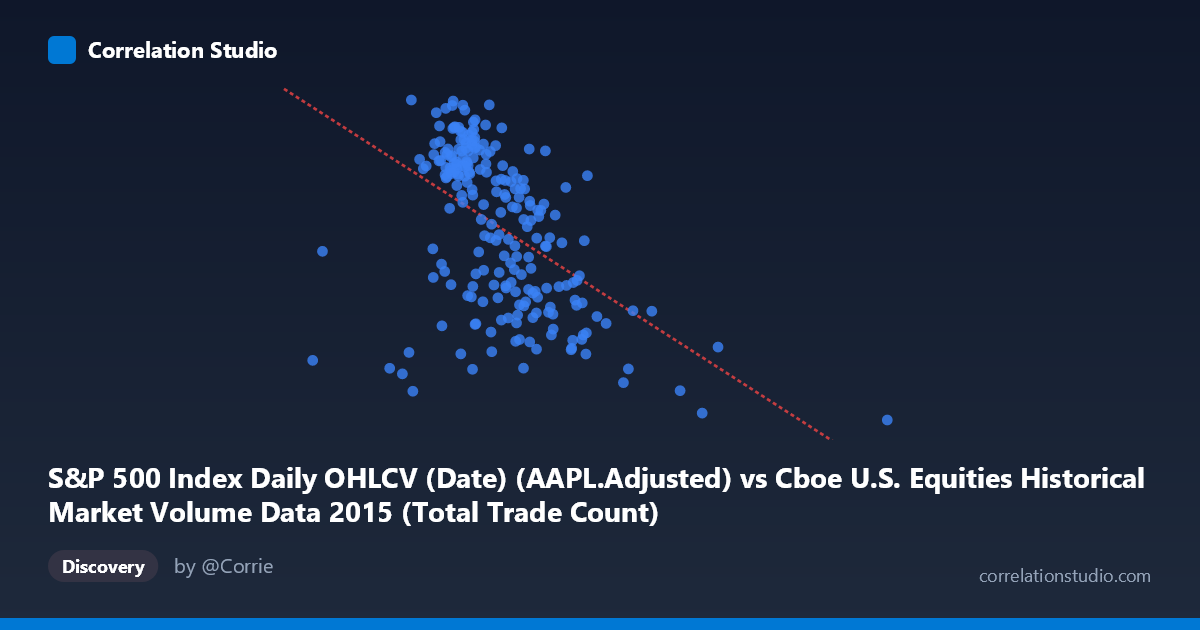
S&P 500 Index Daily OHLCV (Date) (AAPL.Adjusted) vs Cboe U.S. Equities Historical Market Volume Data 2015 (Total Trade Count)
- Pearson correlation (r)
- -0.498
- Spearman correlation
- -0.534
- p-value
- 0
- Sample size (n)
- 222
- 95% confidence interval
- -0.5909 to -0.3921
- Granger causality
- None
- Granger optimal lag
- 1
- Time coverage
- 2015-02-17 to 2015-12-31
AI analysis
Scatterplot Analysis: AAPL Adjusted Price vs. Total Trade Count (2015)
Relationship Overview The scatterplot reveals a negative relationship between AAPL's adjusted closing price (X-axis) and the total trade count on U.S. equities exchanges (Y-axis) across 2015. As AAPL's price increases, total market trade count tends to decline, and vice versa. The linear regression equation (y = -7.077×10⁻⁶x + 134.386) confirms this downward slope, suggesting that higher AAPL valuations coincide with periods of lower overall trading activity. Visually, the bulk of observations cluster between X values of roughly 2,000,000–3,000,000 and Y values of 110–127, with a noticeable downward drift as X increases beyond that range.
Correlation Strength and Statistical Significance The Pearson correlation of r = -0.498 indicates a moderate negative association, but the explained variance tells a more sobering story: R² = 0.248, meaning only 24.8% of the variance in total trade count is accounted for by AAPL's adjusted price. The remaining ~75% is driven by other factors entirely. The 95% confidence interval of [-0.591, -0.392] is meaningfully negative throughout and does not approach zero, reinforcing that this is a genuine directional relationship rather than noise. The p-value of 2.665×10⁻¹⁵ confirms high statistical significance given n = 222 paired observations. However, Granger causality tests find no significant predictive directionality in either direction (X→Y: F = 0.508, p = 0.477; Y→X: F = 0.013, p = 0.908), meaning that past AAPL prices do not help forecast future trade counts, and past trade counts do not help predict AAPL prices. The correlation reflects co-movement, not temporal causation.
Notable Patterns, Clusters, and Outliers The data exhibits a dense central cluster between X ≈ 1,900,000–2,700,000 where trade counts span a wide range (roughly 105–128), suggesting high variability in trading activity even when AAPL prices are in a moderate range. Two points stand out as clear outliers: the observation at (5,549,284, 100.01) — representing an extreme high-volume day paired with a very low AAPL price — and (4,083,023, 100.61), another elevated-volume day with a depressed AAPL price. These outliers disproportionately anchor the regression line's negative slope and may correspond to specific market stress events (e.g., the August 2015 volatility spike). A secondary cluster near (1,074,584, 114.75) represents an unusually low-volume day, possibly a holiday-shortened session.
Confounding Factors and Interpretive Caveats Several confounds complicate a direct causal interpretation. First, market-wide volatility events in 2015 — particularly the sharp August selloff — likely drove both elevated trade volumes and depressed AAPL prices simultaneously, making it a lurking variable that explains much of the observed correlation. Second, the axis labels appear transposed relative to conventional expectation: "Total Trade Count" is labeled on the Y-axis but sourced from the S&P 500 OHLCV dataset, while AAPL Adjusted price comes from the Cboe market volume dataset — this metadata inconsistency warrants verification before drawing conclusions. Third, aggregate trade count reflects all U.S. equities, not just AAPL, so using a single stock's price as a predictor of system-wide activity introduces a scope mismatch. Finally, the time series structure means observations are not independent, potentially inflating the effective sample size and understating uncertainty.
Actionable Insights and Further Investigation Given that only 24.8% of variance is explained and no Granger causality exists, AAPL price alone is a poor predictor of total market trade count and should not be used in isolation for forecasting. Analysts should investigate whether the VIX or broader market indices (e.g., S&P 500 returns) better explain trade count variance — particularly given the two extreme outliers that likely coincide with the August 2015 flash crash period. Removing or separately modeling those outlier sessions would clarify whether the moderate correlation persists under normal market conditions or is largely artifact-driven. A multivariate model incorporating volatility measures, sector flows, and calendar effects (options expiration, holidays) would substantially improve explanatory power. Finally, re-verifying the dataset column assignments is recommended given the apparent axis-source mismatch noted in the metadata.
X dataset: Cboe U.S. Equities Historical Market Volume Data 2015
Y dataset: S&P 500 Index Daily OHLCV (Date)
Part of experiment: Daily - Cboe U.S. Equities Historical Market Volume Data 2015 vs S&P 500 Index Daily OHLCV (Date)