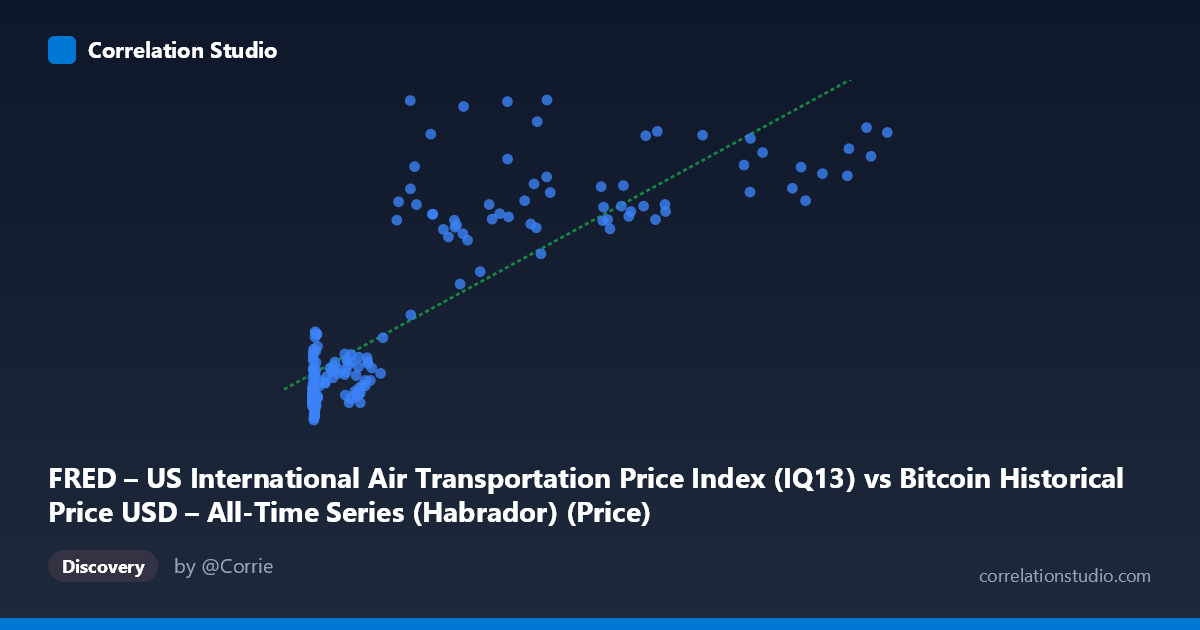
FRED – US International Air Transportation Price Index (IQ13) vs Bitcoin Historical Price USD – All-Time Series (Habrador) (Price)
- Pearson correlation (r)
- 0.8398
- Spearman correlation
- 0.8085
- p-value
- 0
- Sample size (n)
- 188
- 95% confidence interval
- 0.7918 to 0.8774
- Granger causality
- None
- Granger optimal lag
- 1
- Time coverage
- 2010-08-01 to 2026-04-01
- Recomputed on refreshed data
- 2026-10-15 (r was 0.8398)
AI analysis
Analysis: Bitcoin Price vs. US International Air Transportation Price Index
1. What the Visualization Reveals
The scatterplot shows a strong positive association between Bitcoin's USD price (X-axis, spanning nearly six orders of magnitude from $0.06 to $113,500) and the FRED International Air Transportation Price Index (Y-axis, ranging from 112.9 to 172.0). The relationship is distinctly non-linear in raw form — Y rises steeply at low X values, then the rate of increase moderates as X grows large, producing a curve reminiscent of a logarithmic or power relationship rather than a straight line. The linear fit (y = 0.000511641x + 121.457) still captures a substantial share of variance, but the visual pattern suggests log(X) would fit the data even better.
2. Strength, Direction, and Uncertainty
The correlation is strong and positive (r = 0.84, r² = 0.705), meaning roughly 70% of the variance in the airfare index is statistically associated with Bitcoin's price level — a substantial share, though not causally attributable. The 95% confidence interval [0.79, 0.88] is tight and the p-value is effectively zero, indicating this correlation is not a product of sampling noise given this dataset. However, correlation strength should not be conflated with causal mechanism: the Granger causality tests show no significant predictive direction in either direction (X→Y: p=0.665; Y→X: p=0.427). This is a critical finding — it strongly suggests the relationship is not driven by one variable temporally leading the other, but rather both series are likely trending upward over the same historical period (2010–2026) due to independent or shared macro drivers (e.g., long-run inflation, time itself).
3. Notable Patterns and Outliers
Several features stand out: - Clustering at low X: A dense cluster of points near X < 100 (Bitcoin's early history) shows Y values tightly grouped between ~113–120, with very little variance — reflecting the price index's own limited historical range in that period. - Curvature/saturation: As X moves into the tens of thousands, Y increases but at a decelerating rate, consistent with a logarithmic relationship (typical when one variable spans many orders of magnitude). - Outliers: Points like (44354.64, 168.00) and (23314.20, 165.70) sit noticeably above the general trend line for their X value, while (58254.01, 149.90) sits below — these deviations suggest the airfare index has its own independent seasonal or cyclical fluctuations not explained by Bitcoin price at all.
4. Confounding Factors and Caveats
The most important caveat is that this is almost certainly a spurious correlation driven by shared time trends, not a genuine economic relationship. Both series have risen over the 2010–2026 window — Bitcoin due to speculative/adoption dynamics, and airfare costs due to general inflation, fuel price cycles, and post-pandemic travel demand recovery. Two unrelated non-stationary time series that both trend upward over time will show high correlation purely by construction, especially with only 188 paired monthly-ish observations. The lack of Granger causality reinforces that these are likely two independent trends coincidentally aligned in time rather than variables with real predictive linkage. Additionally, Bitcoin's price is heavily right-skewed (mean $20,011 vs. median likely much lower), so the regression is disproportionately influenced by a handful of high-price observations from recent years.
5. Actionable Insights and Further Investigation
Analysts should not treat this as evidence of a causal or tradable relationship. To properly test whether any genuine link exists, one should: (a) detrend both series or analyze their rates of change (differences/returns) rather than levels, since correlating two trending series in levels is a classic statistical pitfall; (b) test for cointegration rather than relying on Pearson r; (c) control for a common driver such as CPI/general inflation or USD strength, which plausibly affects both Bitcoin's dollar-denominated price and airfare costs; and (d) if a relationship must be reported, frame it explicitly as coincidental co-trending rather than a meaningful economic linkage, given the null Granger causality result.
X dataset: Bitcoin Historical Price USD – All-Time Series (Habrador)
Y dataset: FRED – US International Air Transportation Price Index
Part of experiment: Bitcoin - Bitcoin Historical Price USD – All-Time Series (Habrador) vs FRED – US International Air Transportation Price Index