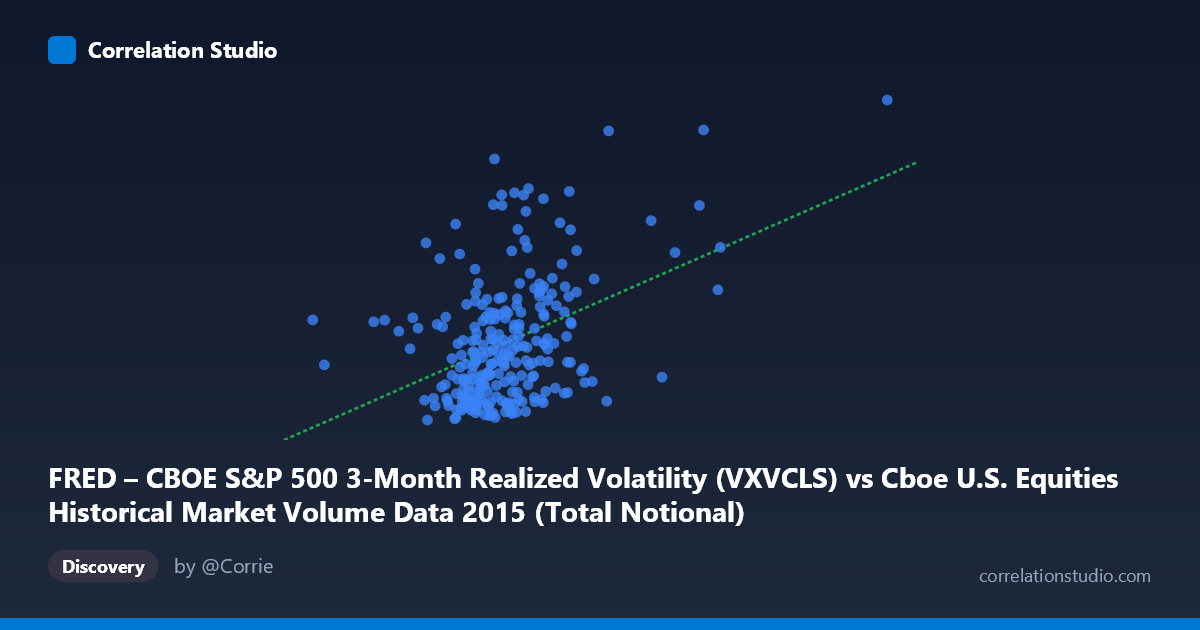
FRED – CBOE S&P 500 3-Month Realized Volatility (VXVCLS) vs Cboe U.S. Equities Historical Market Volume Data 2015 (Total Notional)
- Pearson correlation (r)
- 0.4178
- Spearman correlation
- 0.3482
- p-value
- 0
- Sample size (n)
- 252
- 95% confidence interval
- 0.3103 to 0.5148
- Granger causality
- None
- Granger optimal lag
- 1
AI analysis
Analysis: CBOE S&P 500 3-Month Realized Volatility vs. Total Notional Volume (2015)
Relationship Overview The scatterplot reveals a modest positive relationship between CBOE S&P 500 3-month realized volatility (VXVCLS) and total notional trading volume in U.S. equities markets during 2015. As volatility increases, total notional value traded tends to rise as well — a directionally intuitive finding, since elevated volatility typically drives heightened trading activity. However, the scatter is considerable, with substantial vertical dispersion at nearly every level of the X variable, indicating that volatility is far from a reliable standalone predictor of notional volume. The linear regression equation (y = 3.15×10⁻¹⁰x + 11.82) reflects a positive slope, but the wide cloud of points around the regression line immediately signals that the fit is imperfect.
Correlation Strength and Statistical Significance The Pearson correlation of r = 0.4178 indicates a moderate positive association, but the coefficient of determination tells a more sobering story: r² = 0.1746, meaning realized volatility explains only about 17.5% of the variance in total notional volume. Over 82% of the variation in trading volume is attributable to other factors entirely. The 95% confidence interval of [0.3103, 0.5148] is meaningfully above zero and reasonably tight given the sample size (n = 252 paired observations from a population of N = 3,302), and the p-value of 4.55×10⁻¹² confirms the correlation is highly statistically significant — this is not a chance finding. That said, statistical significance here benefits from a large sample and should not be conflated with practical or economic significance. Critically, the Granger causality tests find no significant predictive direction in either direction (X→Y: F = 0.27, p = 0.60; Y→X: F = 0.09, p = 0.77), meaning that past values of volatility do not predict future notional volume, nor does past volume predict future volatility. The relationship is contemporaneous at best, not temporally causal.
Notable Patterns, Clusters, and Outliers The data points are not uniformly distributed across the volatility range. A dense cluster exists in the lower-to-mid volatility region (approximately X = 15–25 billion, roughly corresponding to VXVCLS values in the 14–22 range), where the majority of 2015 trading days resided. Beyond this core cluster, a handful of high-volatility, high-volume outliers are visible in the upper-right quadrant — these likely correspond to the August 2015 market selloff, a period of acute stress that simultaneously spiked volatility and drove exceptional trading volumes. A point near (35.6B, 29.6) and another near (36.8B, 23.5) stand out as leverage points that may be disproportionately influencing the regression slope. There also appear to be several high-volume days at moderate volatility levels (e.g., around X = 20–21B with Y near 25–28), suggesting that volume spikes can occur independently of sustained volatility elevation — perhaps driven by scheduled events like index rebalances or options expirations.
Confounding Factors and Interpretive Caveats Several important caveats apply. First, the axes appear to have been swapped in the dataset labeling — the X-axis is labeled as the VXVCLS volatility index yet carries values in the billions (consistent with notional volume), while the Y-axis labeled as notional volume shows values in the 14–31 range (consistent with a volatility index). This labeling inversion should be verified before drawing firm conclusions. Second, 2015 is a single calendar year with specific macro events (Fed rate hike expectations, China devaluation shock, commodity collapse), making generalization to other periods risky. Third, realized volatility and notional volume are both endogenous to market conditions — broader risk-off episodes, liquidity crises, or structural market events drive both simultaneously, creating the appearance of correlation without a clean causal mechanism. Seasonality, end-of-quarter flows, and options expiration cycles could also inflate co-movement spuriously.
Actionable Insights and Further Investigation Despite the modest explanatory power, this correlation is practically meaningful for market microstructure researchers and exchange operators who need rough forecasts of volume under different volatility regimes. To improve predictive accuracy, a multivariate model incorporating lagged VIX, economic calendar events, options expiration dates, and intraday session data would likely push r² substantially higher. It would also be worthwhile to test this relationship across multiple years (2007–2024 data is available per the dataset notes) to assess whether 0.42 is a stable structural feature or an artifact of 2015's specific volatility regime. Finally, given the Granger non-causality result, practitioners should not use yesterday's volatility reading as a trading-day volume signal — any operational forecasting model should instead focus on same-day or intraday volatility measures rather than lagged inputs.
X dataset: Cboe U.S. Equities Historical Market Volume Data 2015
Y dataset: FRED – CBOE S&P 500 3-Month Realized Volatility
Part of experiment: Daily - Cboe U.S. Equities Historical Market Volume Data 2015 vs FRED – CBOE S&P 500 3-Month Realized Volatility