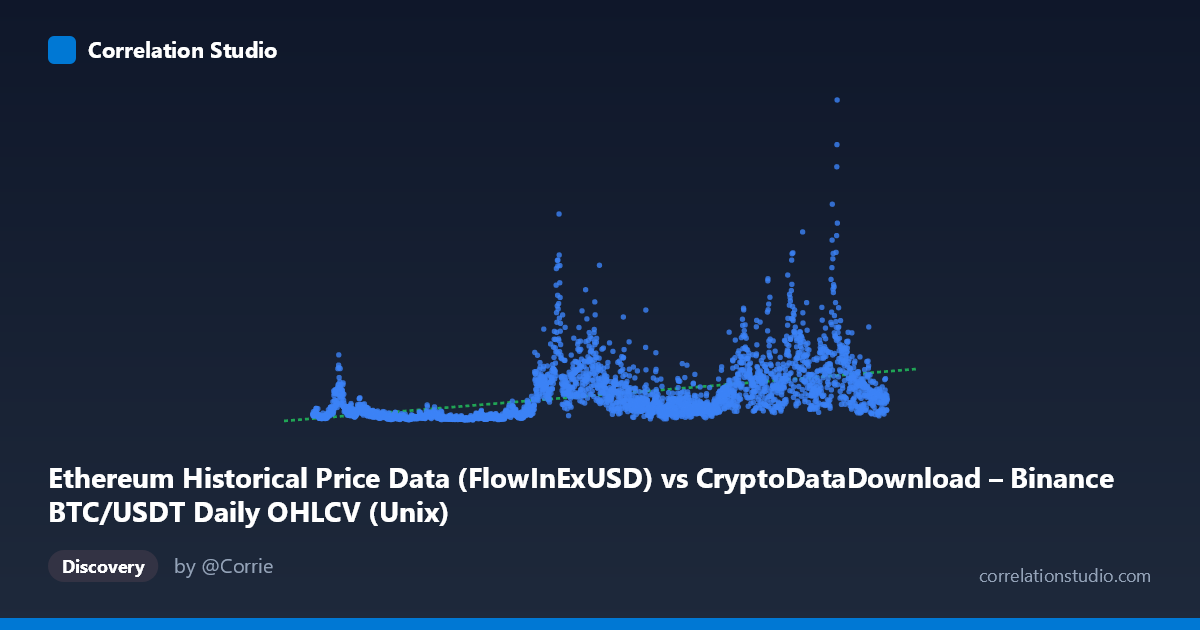
Ethereum Historical Price Data (FlowInExUSD) vs CryptoDataDownload – Binance BTC/USDT Daily OHLCV (Unix)
- Pearson correlation (r)
- 0.4789
- Spearman correlation
- 0.6313
- p-value
- 0
- Sample size (n)
- 3191
- 95% confidence interval
- 0.4517 to 0.5052
- Granger causality
- None
- Granger optimal lag
- 10
- Time coverage
- 2017-08-17 to 2026-05-20
AI analysis
Analysis: BTC/USDT Volume-Related Metric vs. Ethereum Network/Price Metric
1. Overall Relationship
The scatterplot depicts a moderate positive relationship between the X variable (labeled as an Ethereum flow metric but sourced from Binance BTC/USDT OHLCV data) and the Y variable (labeled as Ethereum network/price metrics but sourced from Binance BTC/USDT data as well — note the axis labels appear swapped or mislabeled in the metadata). Despite this labeling ambiguity, the statistical relationship is clear: as X increases, Y tends to increase, but with substantial scatter. The data spans nearly 9 years (2017–2026) of daily observations, giving the correlation strong statistical power despite the wide variability in the underlying series (Y stdev is greater than its mean, indicating a highly right-skewed distribution consistent with crypto market volatility/volume data).
2. Strength, Direction, and Statistical Confidence
The Pearson correlation of r = 0.479 indicates a moderate positive linear association, with r² = 0.229 meaning only ~23% of the variance in Y is explained by X — the majority of Y's variability (77%) stems from other factors. The 95% CI [0.452, 0.505] is tight, and the p-value ≈ 0 confirms this correlation is highly statistically significant (unsurprising given n=3,191), but statistical significance here reflects sample size more than practical strength — a moderate r with huge N will always be "significant." Critically, the Granger causality tests show no significant predictive direction in either direction (X→Y: p=0.185; Y→X: p=0.089, only marginally suggestive at best). This means neither series reliably helps forecast future values of the other using their own lagged history — the correlation is likely contemporaneous/coincidental (both driven by shared market-wide dynamics like BTC price cycles) rather than one causing or leading the other.
3. Notable Patterns and Non-linear Features
Examining the sample points, several patterns emerge: - Extreme skew and heteroscedasticity: Y ranges from ~14M to ~6.9B, with most values clustered under 1B but sporadic massive spikes (e.g., 1,528,969,439 and 1,791,324,307 in early-to-mid 2024). This is classic crypto volume/liquidation data behavior. - Clustering by era: Lower-magnitude points dominate 2017–2020 (e.g., ~47M–170M), while 2023–2025 shows more high-value clusters (500M–1.8B), suggesting a temporal/regime-dependent structure rather than a stable linear relationship — likely reflecting overall market growth (more liquidity, higher BTC prices, larger absolute volumes over time). - Non-linearity flagged: The note that Spearman ρ exceeds Pearson r strongly suggests the true relationship is monotonic but curved — likely logarithmic or power-law, consistent with financial volume/flow data that scales multiplicatively rather than additively.
4. Confounding Factors and Caveats
Several caveats are essential: - Metadata inconsistency: Both axes reference "Binance BTC/USDT Daily OHLCV" data, with Ethereum labels seemingly mismatched — the actual variables being compared should be verified before drawing domain conclusions. - Time is a lurking confound: Both series likely trend upward with overall crypto market cap growth, inflating correlation without direct causal linkage (spurious correlation via shared trend). - Non-stationarity: Financial time series like volume/price are typically non-stationary; running correlation and Granger tests on raw (non-differenced) data can produce misleading results. The lack of Granger causality may partly stem from non-stationarity or the linear-lag framework failing to capture the true (non-linear) dependency structure. - Outlier sensitivity: Extreme values (multi-billion dollar days) can disproportionately influence r and the OLS regression line.
5. Actionable Recommendations
1. Verify variable labeling before further analysis — resolve whether this is truly BTC-vs-BTC or BTC-vs-ETH data. 2. Log-transform both variables and re-run correlation/regression, given the extreme skew and the Spearman/Pearson discrepancy — this will likely reveal a stronger, more linear r² in log-space. 3. Difference or detrend the series (e.g., % daily change) before testing Granger causality to remove shared trend/non-stationarity effects and get a cleaner causal signal. 4. Segment by market regime (bull/bear cycles) to see if the relationship strength changes over time — pooling 9 years of data may mask regime-specific dynamics. 5. Given no Granger causality, avoid using one series to forecast the other in trading strategies; instead, treat both as co-moving with a common latent driver (likely overall crypto market liquidity/volatility) and model that driver directly if possible.
X dataset: CryptoDataDownload – Binance BTC/USDT Daily OHLCV
Y dataset: Ethereum Historical Price Data
Part of experiment: Bitcoin - CryptoDataDownload – Binance BTC/USDT Daily OHLCV vs Ethereum Historical Price Data