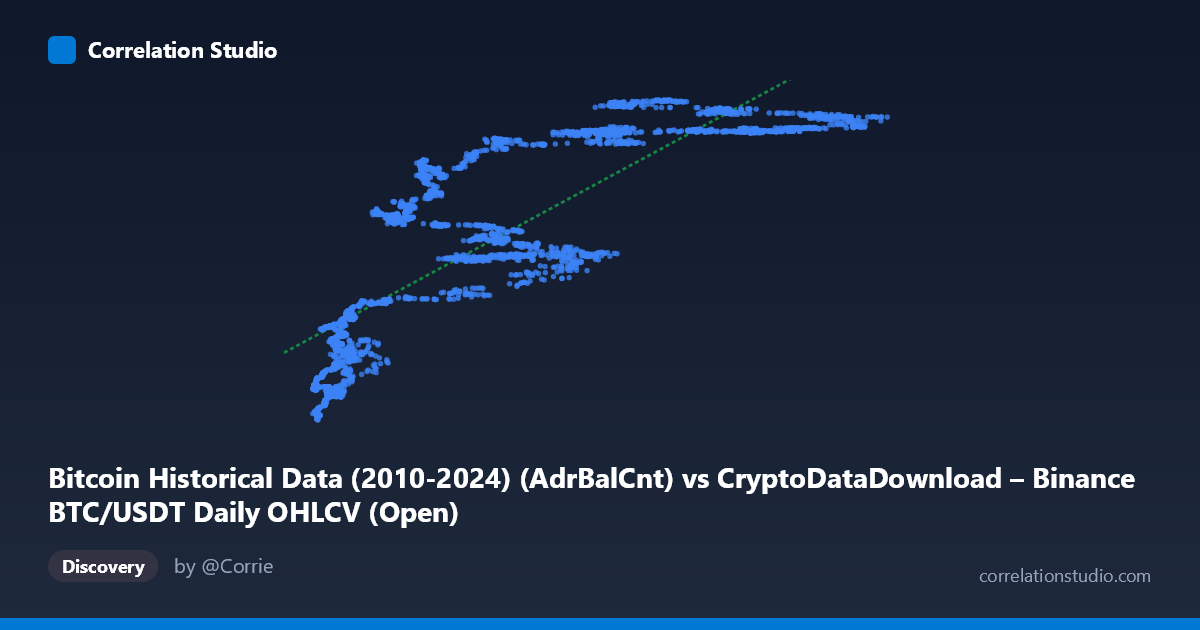
Bitcoin Historical Data (2010-2024) (AdrBalCnt) vs CryptoDataDownload – Binance BTC/USDT Daily OHLCV (Open)
- Pearson correlation (r)
- 0.8284
- Spearman correlation
- 0.8985
- p-value
- 0
- Sample size (n)
- 3191
- 95% confidence interval
- 0.8172 to 0.839
- Granger causality
- Y → X
- Granger optimal lag
- 10
- Time coverage
- 2017-08-17 to 2026-05-20
AI analysis
Analysis of Bitcoin Address Count vs. Opening Price Relationship
1. Relationship Overview The scatterplot reveals a strong, positive, monotonic relationship between the number of active Bitcoin addresses (X) and BTC/USDT opening price (Y). As active address count rises from roughly 3,000 to over 124,000, opening price climbs from ~$18.8M to ~$57M (values appear scaled, likely representing indexed or satoshi-denominated price). The relationship is not strictly linear — it shows a steep rise at low X values (under ~20,000 addresses, price jumps from ~$19M to ~$40M+), followed by a flatter, more saturated relationship at higher X values (60,000–125,000), where price oscillates between $50-57M with much less sensitivity to further address growth. This pattern suggests a logarithmic or saturating curve rather than a simple straight line.
2. Strength, Direction, and Statistical Confidence The correlation coefficient (r = 0.828) indicates a strong positive linear association, with r² = 0.686 meaning 69% of the variance in price is statistically explained by address count — a substantial but incomplete relationship, leaving roughly 31% of price variation driven by other factors (sentiment, macro conditions, liquidity, regulatory news, etc.). The tight 95% CI [0.817, 0.839] and p-value of essentially 0 confirm this correlation is highly reliable and not a product of chance, given the large sample (n=3,191). However, the Granger causality results are the most practically important nuance: Y (price) Granger-causes X (address count), not the reverse (Y→X: p=0.045 significant; X→Y: p=0.149 not significant). This means historical price movements have predictive power over future active address counts — likely because rising prices attract new users/wallets — rather than network adoption driving price. This inverts a common assumption in crypto analysis (that network growth drives price) and should reshape how this relationship is used for forecasting.
3. Notable Patterns and Outliers Several clusters are visible: a dense low-X cluster (X < 15,000, Y between $19-33M) representing early/bear-market periods; a mid-range cluster (X: 20,000-60,000, Y: $33-52M) showing the steepest rate of increase; and a high-X plateau (X 65,000, Y: $51-57M) where price appears capped or saturated despite continued address growth — suggesting diminishing marginal effect of new addresses on price at scale. Some scatter/noise exists in the mid-range (e.g., points like (57,635, $37.2M) sitting below the trend while (60,293, $53.3M) sits above it for similar X), indicating regime-dependent behavior — likely reflecting different market cycles (bull vs. bear) where the same address count corresponds to different price levels depending on broader market conditions.
4. Confounding Factors and Caveats This relationship is likely confounded by time/market cycle effects — both variables trend upward over the 2017-2026 window due to Bitcoin's overall adoption and price appreciation, making the correlation partly a shared-trend artifact rather than a direct causal link. Address count can be inflated by exchange consolidation, mixing services, or wallet-labeling practices (one user, many addresses), while price is influenced by macro liquidity, regulatory events, and speculative trading independent of network fundamentals. The linear R² of 68.6% substantially understates fit quality in the low-X region and overstates it in the high-X plateau, suggesting a log-linear or logistic model would better capture the true relationship and likely increase explained variance.
5. Recommendations for Further Investigation Analysts should (a) fit a non-linear model (log-transform X, or piecewise/logistic regression) to better capture the saturating relationship at high address counts; (b) test with detrended or differenced data to isolate the causal signal from shared time-trend confounding, since Granger causality on raw trending series can be unreliable; (c) explore additional lags beyond 10 periods and validate robustness with alternative causality tests (e.g., transfer entropy); and (d) segment analysis by market regime (bull/bear/sideways) to check whether the price→address relationship holds consistently or is regime-specific. Given the significant Y→X Granger result, address-count metrics should be treated as a lagging indicator of price momentum rather than a leading network-fundamentals signal for trading strategies.
X dataset: CryptoDataDownload – Binance BTC/USDT Daily OHLCV
Y dataset: Bitcoin Historical Data (2010-2024)
Part of experiment: Bitcoin - CryptoDataDownload – Binance BTC/USDT Daily OHLCV vs Bitcoin Historical Data (2010-2024)