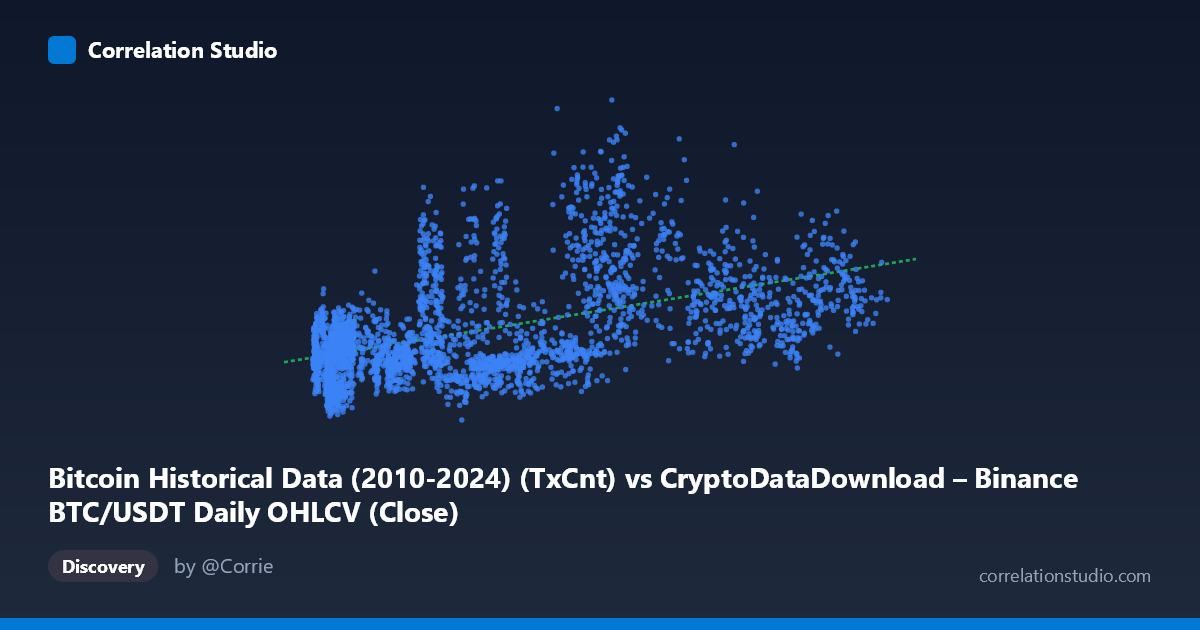
Bitcoin Historical Data (2010-2024) (TxCnt) vs CryptoDataDownload – Binance BTC/USDT Daily OHLCV (Close)
- Pearson correlation (r)
- 0.5026
- Spearman correlation
- 0.5058
- p-value
- 0
- Sample size (n)
- 3191
- 95% confidence interval
- 0.4762 to 0.5281
- Granger causality
- None
- Granger optimal lag
- 10
- Time coverage
- 2017-08-17 to 2026-05-20
AI analysis
Analysis: BTC Transaction Count vs. Closing Price
1. Overall Relationship
The scatterplot reveals a moderate positive correlation between Bitcoin's daily transaction count and its closing price. There is a general upward tendency—as transaction count rises, closing price tends to rise as well—but the relationship is loose and noisy rather than tight and linear. The data cloud is wide and diffuse: at nearly every transaction-count level, closing prices span a broad range (often 200,000+ in Y for a fixed X band), indicating that transaction count alone is a weak predictor of price on any given day.
2. Strength, Direction, and Statistical Confidence
With r = 0.50 and r² = 0.253, only about 25% of the variance in closing price is explained by transaction count—leaving roughly 75% attributable to other factors. This is a real but modest relationship. The 95% CI [0.476, 0.528] is fairly tight given the large sample (n=3,191), and the p-value of ~0 confirms the correlation is statistically significant and not due to chance. However, statistical significance here reflects sample size more than practical predictive strength—p≈0 does not mean the relationship is strong, just that it's reliably non-zero. Critically, the Granger causality tests show no significant predictive direction in either direction (X→Y: p=0.62; Y→X: p=0.88) at the optimal lag of 10 periods. This means neither variable helps forecast the other's future values based on past patterns—the correlation is contemporaneous/associative, not causal or predictive in a time-series sense.
3. Notable Patterns and Outliers
Several features stand out in the sample points: - Low-X, high-Y outliers: Points like (4,378, 211,916) alongside (42,283, 724,837) show that low transaction counts can coincide with both low and very high prices, and vice versa—e.g., (110,187, 446,745) shows high tx-count with only moderate price. - Heteroscedasticity: Variance in Y appears to increase somewhat at higher X values, but also remains large at low X, suggesting the spread isn't simply proportional to X. - Possible regime clustering: The data likely reflects multiple market cycles (2017–2026 span includes at least two bull/bear cycles). Different periods may show different X-Y relationships (e.g., low transaction counts with very high prices during 2020-2021 institutional-driven rallies, vs. higher on-chain activity with lower prices during other phases), which would flatten the aggregate correlation.
4. Confounding Factors and Caveats
This analysis conflates data across ~9 years of Bitcoin's evolution, during which: - On-chain usage patterns shifted (Lightning Network adoption, batching by exchanges, SegWit adoption reduced on-chain footprint per transaction over time). - Price is driven by macro factors (interest rates, ETF approvals, regulatory news, institutional flows) largely independent of raw transaction throughput. - Non-stationarity: Both series likely trend over time; spurious correlation from shared upward trends (rather than genuine mechanistic linkage) is a classic risk with financial time series—this is reinforced by the lack of Granger causality. - Transaction count is a noisy proxy for "network usage"—it doesn't distinguish between retail activity, exchange consolidation, or spam/dust transactions.
5. Suggested Next Steps
- De-trend and test stationarity (e.g., differencing, log returns) before re-running correlation and Granger tests, since raw price and tx-count both likely have strong trends that inflate r artificially. - Segment by market era/halving cycle to check if the X-Y relationship is stable or regime-dependent. - Explore nonlinear or lagged transformations (e.g., log(X), rolling averages) and alternative on-chain metrics (active addresses, fees, hash rate) that may have tighter causal links to price. - Treat this correlation as descriptive, not predictive—given the null Granger result, don't use transaction count as a standalone trading signal for price direction.
X dataset: CryptoDataDownload – Binance BTC/USDT Daily OHLCV
Y dataset: Bitcoin Historical Data (2010-2024)
Part of experiment: Bitcoin - CryptoDataDownload – Binance BTC/USDT Daily OHLCV vs Bitcoin Historical Data (2010-2024)