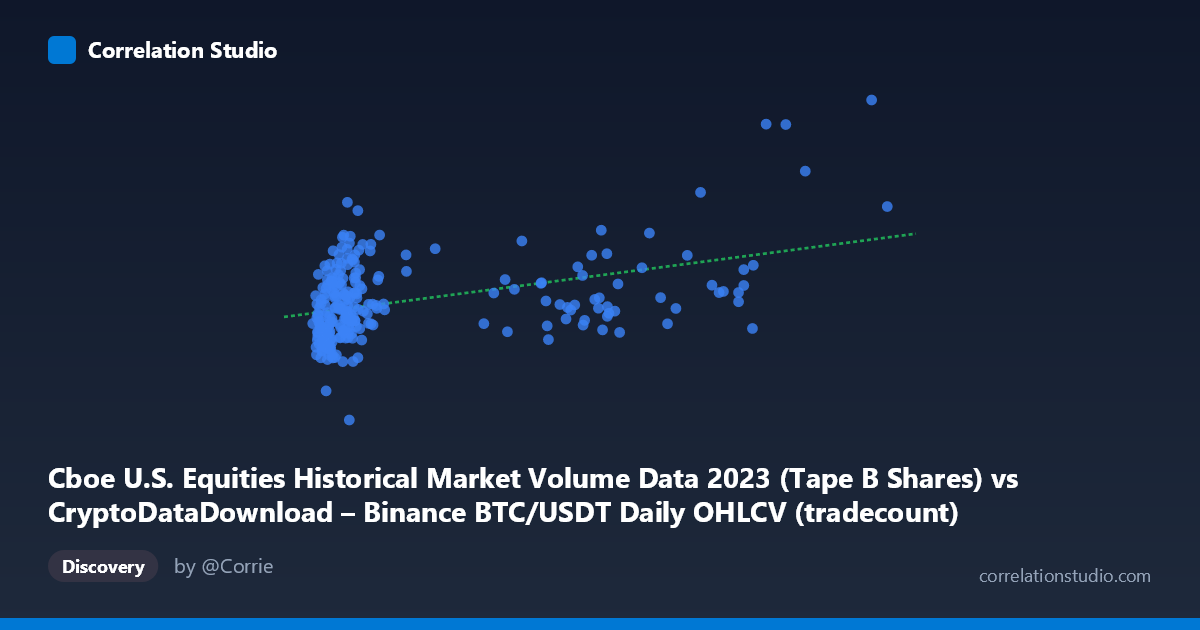
Cboe U.S. Equities Historical Market Volume Data 2023 (Tape B Shares) vs CryptoDataDownload – Binance BTC/USDT Daily OHLCV (tradecount)
- Pearson correlation (r)
- 0.4197
- Spearman correlation
- 0.4024
- p-value
- 0
- Sample size (n)
- 250
- 95% confidence interval
- 0.3118 to 0.5168
- Granger causality
- None
- Granger optimal lag
- 10
- Time coverage
- 2023-01-03 to 2023-12-29
AI analysis
Analysis of Cboe U.S. Equities Volume vs. Binance BTC/USDT Tradecount
1. What the Visualization Reveals
The scatterplot shows a modest positive association between two variables that, notably, are mismatched in their labeling — the "X-axis" data (Cboe equities volume) and "Y-axis" data (BTC/USDT tradecount) appear to be paired by date rather than by any causal or mechanistic link. The data cloud is heavily concentrated in the lower-left region (X values mostly under 2 million, Y values clustered between roughly 75M–130M), with a long right-tail of sparse outliers extending to X ≈ 11.8 million. This pattern suggests the relationship is driven largely by a small number of high-leverage points rather than a consistent trend across the full range.
2. Strength, Direction, and Statistical Confidence
The correlation coefficient (r = 0.42) indicates a weak-to-moderate positive linear relationship, and r² = 0.176 tells us that only about 17.6% of the variance in one variable is explained by the other — leaving over 82% attributable to other factors or noise. The 95% confidence interval [0.31, 0.52] is reasonably tight and excludes zero, and the p-value (4.37E-12) confirms this correlation is statistically significant and not due to chance, given the sample size. However, statistical significance should not be conflated with practical importance: the relationship, while real, is not strong enough to support reliable point predictions of one variable from the other. Critically, the Granger causality tests (optimal lag = 10 periods) show no significant predictive direction in either direction (X→Y: p = 0.546; Y→X: p = 0.895). This strongly suggests the correlation is contemporaneous/coincidental rather than reflecting any lead-lag or causal mechanism — neither series helps forecast the other over time.
3. Notable Patterns and Outliers
The bulk of the data forms a dense cluster with X < 2M and Y spanning 75M–130M, showing considerable vertical scatter at similar X values (e.g., multiple points near X≈750,000 range from Y=78M to Y=118M), indicating weak local correlation within the main cluster. The sparse high-X outliers (X 5.6M, particularly the cluster around 7.4M–11.8M) appear to pull the regression line's slope upward; without these ~8 points, the correlation would likely weaken further. One clear anomaly is the point (1,379,414, 42,021,927) — a Y-value far below the rest of the distribution (roughly 2 standard deviations below the mean), which could be a data-quality issue or a genuine extreme event. No obvious non-linear curvature (e.g., logarithmic or exponential shape) is apparent; the relationship looks broadly linear but noisy.
4. Confounding Factors and Caveats
This pairing conflates two structurally unrelated markets: Binance BTC/USDT crypto trading and Cboe U.S. equities market volume. Any observed correlation is more plausibly explained by shared macro drivers — such as overall market volatility, risk sentiment, seasonal trading patterns, or macroeconomic news cycles — that simultaneously affect trading activity across asset classes, rather than any direct interaction between crypto and equities microstructure. Additionally, both series are time series (daily data over 2023), so they may exhibit autocorrelation and shared trends/seasonality that inflate the correlation coefficient in a classic "spurious regression" fashion — a well-known pitfall when correlating two non-stationary time series without differencing or detrending.
5. Suggested Next Steps
Given the lack of Granger causality and weak r², this correlation should not be used for predictive trading models linking equities volume to crypto activity. To clarify whether the relationship is genuine or spurious, analysts should: (a) test both series for stationarity (ADF test) and consider differencing before re-correlating; (b) investigate common third factors (VIX, macro news days, holidays) that might jointly drive both volumes; (c) examine the high-X outlier cluster (X 5M) separately to see if these correspond to specific high-volatility dates (e.g., banking crises, Fed announcements) that could be driving the entire correlation; and (d) treat the y=42M outlier as a candidate for data validation before drawing further conclusions.
X dataset: CryptoDataDownload – Binance BTC/USDT Daily OHLCV
Y dataset: Cboe U.S. Equities Historical Market Volume Data 2023
Part of experiment: Bitcoin - CryptoDataDownload – Binance BTC/USDT Daily OHLCV vs Cboe U.S. Equities Historical Market Volume Data 2023