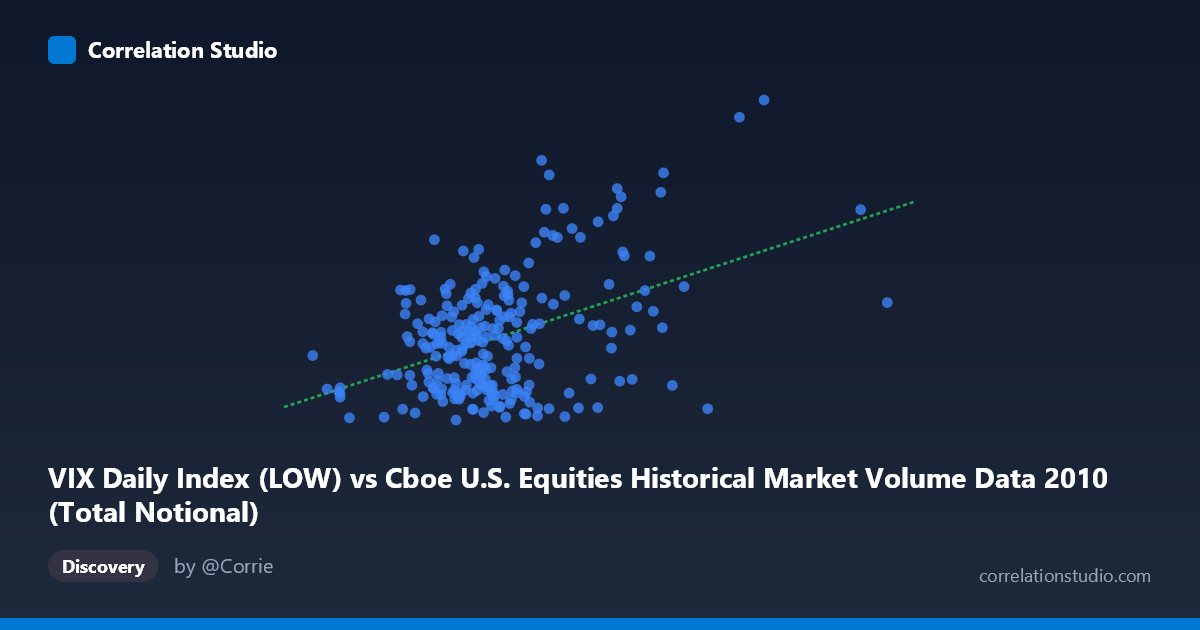
VIX Daily Index (LOW) vs Cboe U.S. Equities Historical Market Volume Data 2010 (Total Notional)
- Pearson correlation (r)
- 0.4322
- Spearman correlation
- 0.2631
- p-value
- 0
- Sample size (n)
- 252
- 95% confidence interval
- 0.326 to 0.5276
- Granger causality
- Y → X
- Granger optimal lag
- 1
AI analysis
Analysis: VIX Total Notional vs. Market Volume (VIX Low) — 2010
1. Overall Relationship Revealed
The scatterplot reveals a modest positive relationship between the Cboe VIX Daily Index Low values (X-axis) and Total Notional market volume (Y-axis) across 252 trading days in 2010. As market volume increases, VIX levels tend to drift upward, suggesting that higher trading activity is loosely associated with elevated market uncertainty or volatility. However, the scatter is substantial — the cloud of points is wide and diffuse, indicating that volume alone is far from a reliable predictor of VIX levels. The linear regression line (y = 3.80×10⁻¹⁰x + 14.78) has a very shallow positive slope, visually confirming a weak but discernible trend rather than a tight, mechanistic relationship.
2. Correlation Strength, Direction, and Causality
The Pearson correlation of r = 0.4322 indicates a moderate positive association, but the r² of 0.1868 is the critical interpretive anchor: only 18.7% of the variance in VIX levels is explained by market volume, leaving over 81% attributable to other forces. The 95% confidence interval of [0.3260, 0.5276] is reasonably narrow given the sample size of 252, and the p-value of 6.85×10⁻¹³ makes the correlation highly statistically significant — this is almost certainly not a chance finding. Crucially, the Granger causality analysis points unidirectionally: Y Granger-causes X (F = 7.64, p = 0.006), meaning that past VIX levels have statistically significant predictive power over future market volume, but the reverse is not true (X→Y: F = 2.14, p = 0.145). This temporal asymmetry is practically important — volatility sentiment appears to lead trading activity rather than respond to it, at a 1-period lag.
3. Notable Patterns, Clusters, and Outliers
Several structural features stand out in the data. The bulk of observations cluster in the lower-left region (volumes roughly 10–22 billion, VIX lows around 15–25), reflecting typical low-volatility, moderate-volume trading days characteristic of much of 2010. A secondary, more dispersed cluster emerges at higher volume and higher VIX values (25–40 range), consistent with episodic stress periods such as the European sovereign debt crisis and the May 2010 Flash Crash. Several clear outliers are visible at extreme coordinates — notably one point near (42.5B, 31.7) and another near (34.4B, 39.0) — suggesting specific days of extraordinary market stress combined with elevated volume. Interestingly, some high-volume days show low VIX readings (e.g., ~24.9B, 16.2), indicating that volume spikes can also occur in calm environments, potentially driven by index rebalancing or option expiration events rather than fear.
4. Confounding Factors and Caveats
Several important caveats temper interpretation. First, 2010 was an unusually eventful year — the Flash Crash (May 6), ongoing post-2008 recovery dynamics, and eurozone instability created structural regime shifts that inflate any measured correlation compared to a more "normal" year. Second, the axes are mismatched by dataset origin: the X variable is from the market volume dataset while the Y variable is from the VIX dataset, and the column assignments (VIX Low on X, Total Notional on Y) may reflect a non-intuitive pairing that deserves scrutiny. Third, Granger causality ≠ true causality — the result that VIX predicts volume may simply reflect that both are driven by common macro shocks with differing response lags. Fourth, the VIX "Low" specifically (rather than close or average) may introduce a systematic downward bias in measured volatility, potentially compressing the upper range of correlation. Finally, daily aggregation masks intraday dynamics where the volume-volatility feedback loop operates on minute-to-minute timescales.
5. Actionable Insights and Further Investigation
The Granger causality finding — that VIX predicts volume with a 1-day lag — has practical trading implications: elevated VIX readings could serve as a leading indicator for next-day volume surges, useful for liquidity planning, execution strategy (VWAP/TWAP scheduling), and market-making inventory management. To strengthen this analysis, investigators should: (a) extend the time series beyond 2010 to test whether the r = 0.43 finding is stable across different volatility regimes; (b) segment the data by event type (Flash Crash vs. normal days) to assess whether outliers are driving the correlation; (c) test nonlinear models (e.g., log-log regression or polynomial fits), as the volume-volatility relationship is theoretically expected to be convex; and (d) incorporate VIX Close or VIX Average rather than Low to reduce measurement-choice sensitivity. A multivariate model controlling for day-of-week effects, options expiration calendars, and macro news events would substantially improve explanatory power beyond the current 18.7%.
X dataset: Cboe U.S. Equities Historical Market Volume Data 2010
Y dataset: VIX Daily Index
Part of experiment: Daily - Cboe U.S. Equities Historical Market Volume Data 2010 vs VIX Daily Index