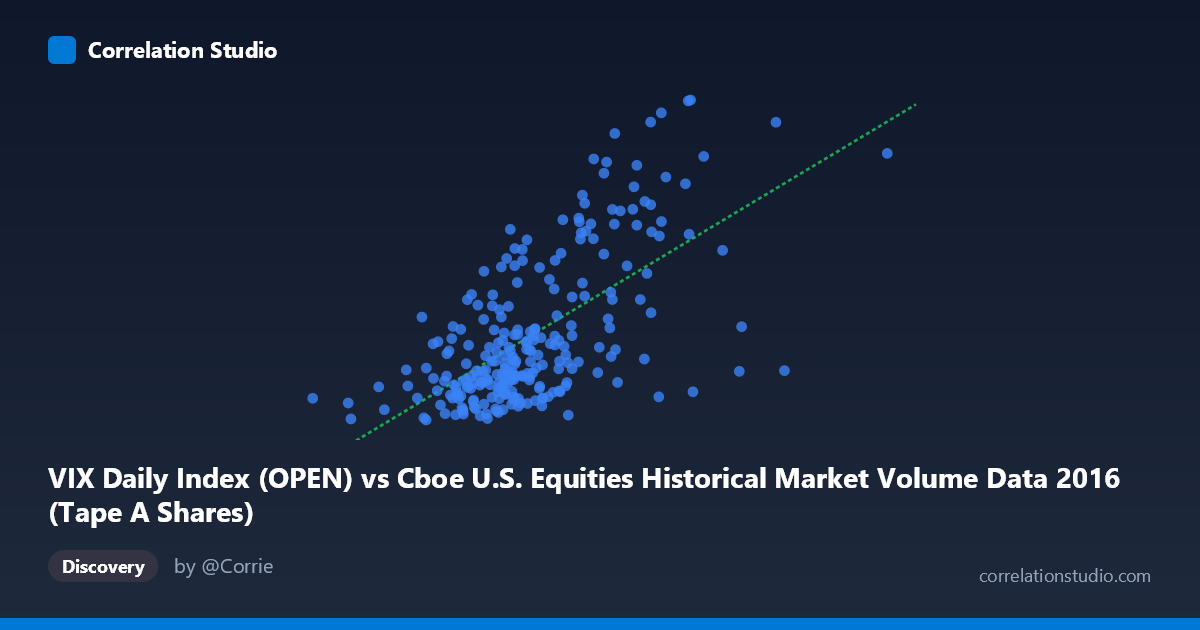
VIX Daily Index (OPEN) vs Cboe U.S. Equities Historical Market Volume Data 2016 (Tape A Shares)
- Pearson correlation (r)
- 0.6324
- Spearman correlation
- 0.5834
- p-value
- 0
- Sample size (n)
- 252
- 95% confidence interval
- 0.5519 to 0.7011
- Granger causality
- None
- Granger optimal lag
- 1
- Time coverage
- 2016-01-04 to 2016-12-30
- Recomputed on refreshed data
- 2026-10-09 (r was 0.6324)
AI analysis
Scatterplot Analysis: VIX Daily Index vs. Tape A Share Volume (2016)
Relationship Overview The scatterplot reveals a moderate positive relationship between Cboe U.S. Equities market volume (Tape A Shares, on the X-axis) and the VIX Daily Index open values (Y-axis) across 252 trading days in 2016. The linear regression equation (y = 4.36e-8·x + 4.14) confirms that as daily equity market volume increases, VIX levels tend to rise correspondingly. This relationship is economically intuitive: periods of heightened market uncertainty or stress typically drive both elevated volatility (VIX) and increased trading activity, as investors reposition portfolios in response to fear or rapid price movements.
Correlation Strength and Statistical Significance The Pearson correlation of r = 0.6324 indicates a moderately strong positive association. However, the r² of 0.40 is the more sobering metric — it means that only 40% of the variance in VIX levels is explained by volume alone, leaving 60% attributable to other factors. The 95% confidence interval [0.55, 0.70] is meaningfully wide, reflecting genuine uncertainty in the true population relationship, though the p-value of effectively zero confirms this is not a chance finding given n = 252. Critically, Granger causality tests find no significant predictive direction in either direction (X→Y: F = 0.54, p = 0.46; Y→X: F = 0.63, p = 0.43), meaning that knowing yesterday's volume does not reliably predict today's VIX, and vice versa. This suggests the two variables move together contemporaneously — likely driven by common shocks — rather than one leading the other temporally.
Notable Patterns, Clusters, and Outliers The sample points reveal several visually distinct features. The bulk of observations cluster in a relatively compact region around X = 220–300 million shares and Y = 12–17 VIX points, consistent with the relatively calm market environment of mid-2016. However, there are notable high-leverage outliers in the upper right — particularly the point near (363M shares, 27.79 VIX) and another near (312M shares, 23.30), which likely correspond to the Brexit vote in late June 2016, a known spike event. A handful of points around VIX = 21–23 similarly stand apart from the dense core cluster. These outlier events disproportionately drive the correlation upward; without them, the r value would likely be considerably weaker, suggesting the relationship may be episodic rather than persistent.
Confounding Factors and Caveats Several important caveats apply. First, the relationship is almost certainly driven by shared responses to exogenous shocks (e.g., Brexit, U.S. election uncertainty in late 2016) rather than a direct causal mechanism between volume and volatility. Second, the VIX is a forward-looking implied volatility measure derived from options pricing, while Tape A share volume reflects realized equity trading — these measure fundamentally different dimensions of market activity, and their co-movement may simply reflect a latent "market stress" factor. Third, time-series autocorrelation in both variables (common in financial data) could inflate the apparent correlation and reduce the effective degrees of freedom below n = 252, potentially making the confidence interval optimistically narrow. Finally, 2016 was an unusual year with discrete geopolitical shocks, limiting the generalizability of these findings to other periods.
Actionable Insights and Further Investigation Practitioners should avoid using volume alone as a VIX predictor given the Granger causality null result and the unexplained 60% variance. More productive next steps would include: (1) introducing a latent market stress index or news sentiment variable to test whether the volume-VIX correlation attenuates, confirming confounding; (2) applying regime-switching or quantile regression to separately model the behavior in calm versus stressed periods, given the apparent cluster-plus-outlier structure; (3) extending the analysis across multiple years to test whether 2016's relationship is anomalous or stable; and (4) examining intraday data to explore whether contemporaneous (within-day) relationships are stronger than the daily lag structure tested here, which might explain the Granger null result.
X dataset: Cboe U.S. Equities Historical Market Volume Data 2016
Y dataset: VIX Daily Index
Part of experiment: Daily - Cboe U.S. Equities Historical Market Volume Data 2016 vs VIX Daily Index