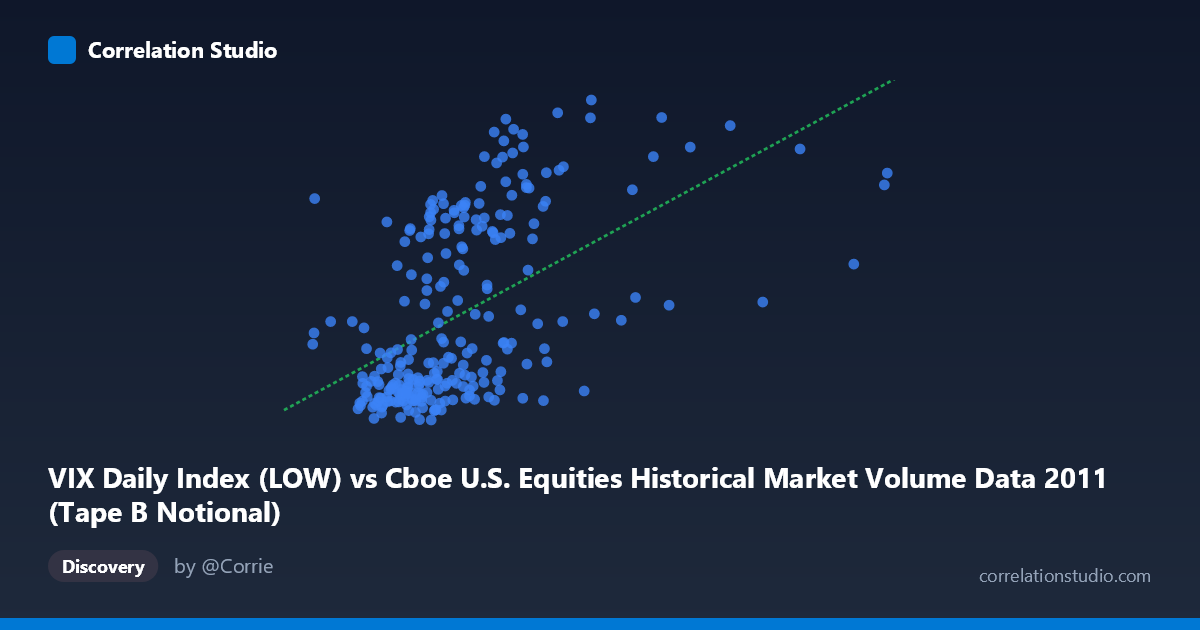
VIX Daily Index (LOW) vs Cboe U.S. Equities Historical Market Volume Data 2011 (Tape B Notional)
- Pearson correlation (r)
- 0.5225
- Spearman correlation
- 0.5768
- p-value
- 0
- Sample size (n)
- 252
- 95% confidence interval
- 0.4264 to 0.6069
- Granger causality
- None
- Granger optimal lag
- 1
AI analysis
Scatterplot Analysis: VIX Tape B Notional vs. VIX Daily Index Low
Relationship Overview
The scatterplot reveals a moderate positive relationship between the VIX Daily Index Low values (X-axis, representing daily low readings of the CBOE Volatility Index) and Tape B Notional trading volume (Y-axis, representing U.S. equities market notional value). As VIX low readings increase — indicating elevated baseline volatility — Tape B Notional volume tends to rise as well. This is broadly consistent with the well-established market intuition that heightened uncertainty drives greater trading activity. The linear regression equation (y = 2.209e-9x + 11.87) confirms a positive slope, though the intercept suggests a meaningful baseline volume exists even at very low VIX levels.
Correlation Strength and Statistical Significance
The Pearson correlation of r = 0.5225 indicates a moderate positive association, but the explanatory power is more modest than the headline number suggests. With r² = 0.2730, only about 27.3% of the variance in Tape B Notional is attributable to VIX Low levels, meaning nearly three-quarters of volume variability is driven by other factors entirely. The 95% confidence interval of [0.4264, 0.6069] is reasonably tight given the sample size of 252, and the p-value of effectively zero confirms this relationship is statistically distinguishable from noise at any conventional threshold. However, statistical significance here is partly a function of the large population (N = 3,780), so practical significance warrants caution. Critically, Granger causality tests find no significant predictive directionality in either direction — neither X→Y (F = 0.070, p = 0.792) nor Y→X (F = 0.007, p = 0.934) — meaning that knowing today's VIX Low does not help predict tomorrow's Tape B Notional volume, and vice versa. The relationship appears contemporaneous rather than temporally sequential.
Notable Patterns, Clusters, and Outliers
Several structural features stand out in the data. The sample points suggest two loose clusters: one concentrated at lower VIX Low values (roughly 3.0–4.5 billion range) paired with lower notional volumes (15–20 range), and another at higher VIX values (5.0–10+ billion) with more dispersed and elevated notional readings. There is considerable vertical spread at mid-range X values, indicating high conditional variance. Several apparent outliers are visible — notably points like (9,956,196,749, 37.50) and (6,102,922,960, 39.88), which represent episodes of simultaneously extreme VIX readings and elevated notional volume, likely corresponding to specific market stress events in 2011 (e.g., the U.S. debt ceiling crisis or European sovereign debt escalations in August–October 2011). These high-leverage points may be disproportionately inflating the overall correlation.
Confounding Factors and Interpretive Caveats
Several caveats should temper interpretation. First, both variables share a common driver: broad market stress. The VIX itself is derived from options pricing, while Tape B Notional reflects equity trading — both are downstream of the same macro uncertainty shocks, making their correlation partly spurious in a causal sense. Second, 2011 was an unusually volatile year, featuring multiple distinct risk-off episodes, which may produce a correlation structure that doesn't generalize to calmer market regimes. Third, the axes appear swapped from their natural labeling (VIX data appears on the X-axis while market volume data appears on the Y-axis), which is worth verifying against the source datasets. Fourth, Tape B specifically covers NYSE American and regional exchange securities, a subset of total market activity, so results may not generalize to the full market. Finally, the absence of Granger causality suggests omitted variables (e.g., news events, institutional rebalancing schedules) likely govern the timing of both series simultaneously.
Actionable Insights and Further Investigation
Practitioners should avoid using VIX Low levels as a standalone predictor of Tape B Notional volume given the weak temporal predictive power confirmed by Granger tests. More productive next steps would include: (1) testing non-linear specifications (e.g., log-log or polynomial regression) since volatility-volume relationships often follow power-law dynamics; (2) segmenting the data by identified market stress regimes (pre/post August 2011) to assess whether the correlation is structurally stable or event-driven; (3) incorporating VIX term structure variables (spot vs. futures) and options volume alongside equity volume for a richer multivariate model; and (4) examining whether VIX High or VIX Close produces stronger or more temporally predictive correlations than VIX Low, since daily lows may underrepresent intraday stress. The 72.7% unexplained variance represents a substantial opportunity for model improvement through additional explanatory variables.
X dataset: Cboe U.S. Equities Historical Market Volume Data 2011
Y dataset: VIX Daily Index
Part of experiment: Daily - Cboe U.S. Equities Historical Market Volume Data 2011 vs VIX Daily Index