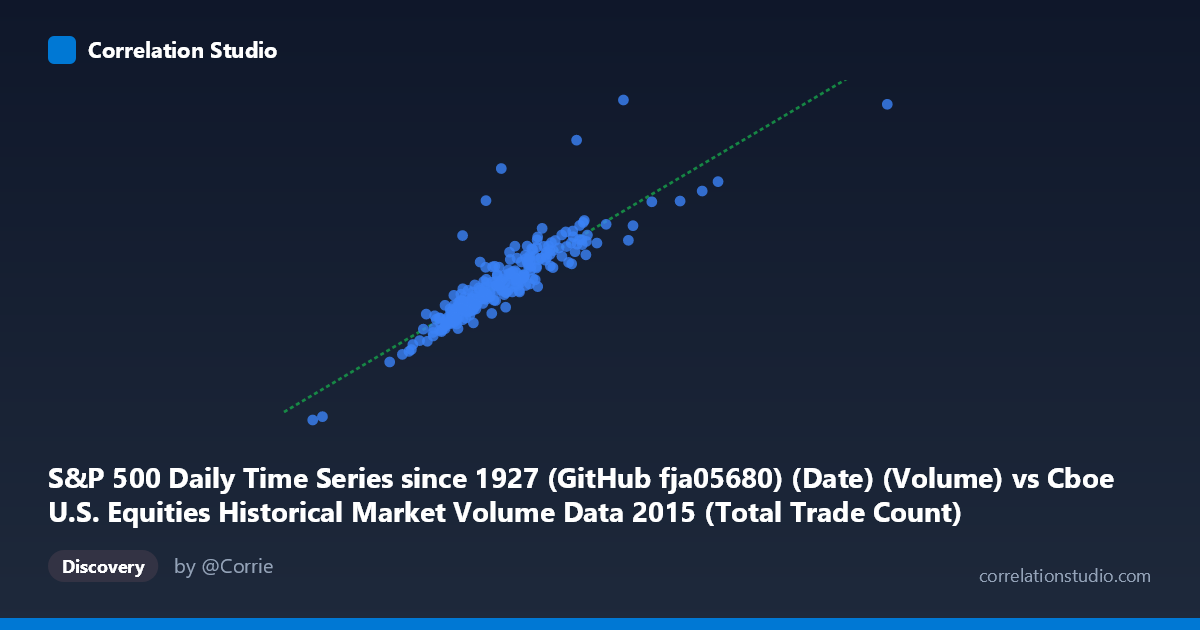
S&P 500 Daily Time Series since 1927 (GitHub fja05680) (Date) (Volume) vs Cboe U.S. Equities Historical Market Volume Data 2015 (Total Trade Count)
- Pearson correlation (r)
- 0.8856
- Spearman correlation
- 0.9202
- p-value
- 0
- Sample size (n)
- 252
- 95% confidence interval
- 0.8556 to 0.9096
- Granger causality
- Bidirectional
- Granger optimal lag
- 10
AI analysis
Analysis: S&P 500 Trading Volume vs. Total Trade Count (2015)
Relationship Overview The scatterplot reveals a strong positive linear relationship between S&P 500 daily trading volume and the total trade count across U.S. equities exchanges in 2015. As daily share volume increases, the total number of trades rises proportionally, which is intuitively sensible — higher market activity days tend to generate both more shares changing hands and more discrete transaction events. The linear regression equation (y = 1231.14x + 5.95×10⁸) suggests that each additional unit of volume is associated with approximately 1,231 additional trades, with a substantial baseline intercept implying a floor of trading activity even on lower-volume days.
Correlation Strength and Statistical Significance The correlation is strong (r = 0.8856), and the R² of 0.7842 indicates that roughly 78.4% of the variance in total trade count is explained by trading volume — a meaningful explanatory relationship, though ~21.6% of variance remains attributed to other factors. The 95% confidence interval [0.856, 0.910] is narrow and entirely positive, reflecting high precision in the estimate given the large sample (n = 252, N = 3,302). The p-value of effectively zero confirms this is not a chance finding. The Granger causality analysis reveals bidirectional temporal predictive relationships at a 10-period lag: Y→X is the stronger direction (F = 2.76, p = 0.003), suggesting total trade count has somewhat more predictive power over future volume than vice versa (X→Y: F = 1.90, p = 0.047). This bidirectionality complicates simple causal narratives — both metrics appear to co-evolve, likely driven by shared underlying market conditions rather than one cleanly causing the other.
Notable Patterns, Clusters, and Outliers The data is broadly clustered in the range of roughly 1.8M–3.2M volume units against 2.5B–4.5B trades, consistent with typical 2015 trading days. However, several notable features stand out: a high-leverage outlier at approximately (997K, 1.41B) sits isolated at the lower-left extreme, likely representing an unusually quiet market day (possibly a holiday-adjacent session). At the upper end, a few points approaching 4–5.5M volume with trade counts near 5–6.7B suggest high-volatility episodes — potentially corresponding to the August 2015 market correction, which saw historically elevated activity. One point at roughly (2.18M, 4.45B) appears to deviate notably above the regression line, suggesting an anomalous day where trade count was disproportionately high relative to volume (possibly reflecting many small-lot, high-frequency trades).
Confounding Factors and Caveats Several important caveats apply. First, both variables are derivatives of overall market activity, meaning they may largely co-vary because both respond to the same third factors (volatility spikes, macroeconomic announcements, index rebalancing events) rather than one causing the other. Second, the datasets originate from different sources (Cboe market data vs. Yahoo Finance S&P 500 data), introducing potential measurement inconsistencies — "volume" in the S&P 500 series and Cboe's "total trade count" are not identical constructs and may aggregate differently. Third, secular intraday and seasonal patterns (e.g., end-of-quarter rebalancing, option expiration Fridays) likely introduce structured clustering that the linear model does not capture. The bidirectional Granger causality at a 10-period lag also warrants caution — statistical Granger causality does not imply economic causation and may reflect shared auto-correlation structures.
Actionable Insights and Further Investigation Practitioners could use this relationship as a real-time market stress indicator: deviations from the regression line (especially upward spikes in trade count relative to volume) may signal fragmented, algorithmic, or high-frequency trading surges worth monitoring for liquidity risk. For further investigation, it would be valuable to decompose residuals by date to identify whether outliers cluster around known market events (August 2015 volatility, Fed announcements). Incorporating realized volatility (VIX) as a covariate in a multiple regression would likely absorb much of the unexplained 21.6% variance and clarify whether volume-trade relationships shift under stress conditions. Finally, extending the Granger analysis across multiple years would test whether the bidirectional relationship and optimal lag are stable structural features or artifacts of 2015's specific market regime.
X dataset: Cboe U.S. Equities Historical Market Volume Data 2015
Y dataset: S&P 500 Daily Time Series since 1927 (GitHub fja05680) (Date)
Part of experiment: Daily - Cboe U.S. Equities Historical Market Volume Data 2015 vs S&P 500 Daily Time Series since 1927 (GitHub fja05680) (Date)