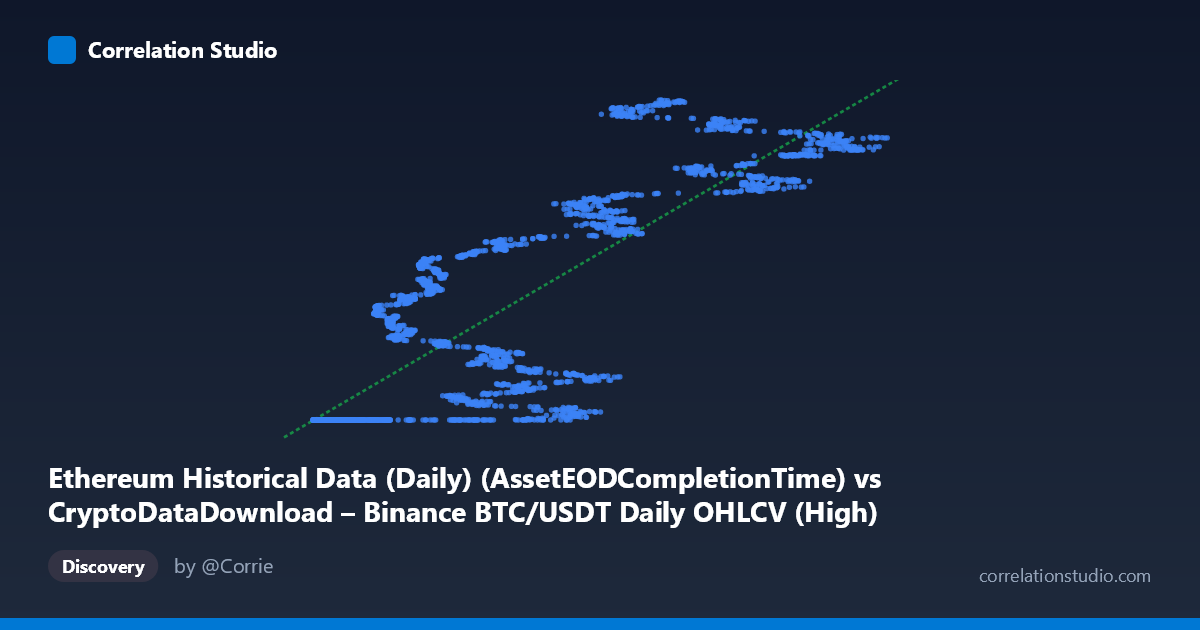
Ethereum Historical Data (Daily) (AssetEODCompletionTime) vs CryptoDataDownload – Binance BTC/USDT Daily OHLCV (High)
- Pearson correlation (r)
- 0.8505
- Spearman correlation
- 0.886
- p-value
- 0
- Sample size (n)
- 3191
- 95% confidence interval
- 0.8407 to 0.8599
- Granger causality
- None
- Granger optimal lag
- 10
- Time coverage
- 2017-08-17 to 2026-05-20
AI analysis
Analysis: X-Variable vs. Y-Variable Relationship
1. What the visualization reveals
The scatterplot depicts a strong positive, though notably non-linear, relationship between the X variable (ranging 3,276–126,200) and Y variable (ranging ~1.61B–1.78B). The data reveals a distinctive pattern: a large cluster of points sits at a "floor" value of Y ≈ 1,614,335,000 across a wide range of low-to-mid X values (roughly 3,000–25,000), followed by a steep, more continuous upward climb in Y as X increases beyond ~25,000–30,000. This creates a shape more consistent with a threshold or saturation curve than a simple straight line, even though the linear fit still captures a majority of the variance.
2. Strength, direction, and statistical confidence
The Pearson correlation (r = 0.85) indicates a strong positive linear association, with r² = 0.723 meaning roughly 72% of the variance in Y is statistically explained by X — a substantial but incomplete share, leaving ~28% driven by other factors or non-linear structure. The 95% CI [0.841, 0.860] is tight, and the p-value ≈ 0 confirms this correlation is essentially certain not to be a chance artifact given the large sample (n=3,191). However, the Granger causality tests show no significant predictive direction in either direction (X→Y: p=0.315; Y→X: p=0.129) at the optimal 10-period lag. This is a critical distinction: strong contemporaneous correlation does not imply that one series temporally leads or forecasts the other — these two series move together but don't Granger-cause one another in a predictive/lagged sense.
3. Notable patterns and features
The most salient non-linear feature is the "flat floor" cluster where dozens of points share nearly identical Y-values (~1,614,335,200–1,614,335,700) despite X varying substantially (roughly 3,900–25,000). This suggests a data-generating artifact — possibly a fixed/minimum value, a data-collection start-point effect, or an index floor — rather than organic covariation. Beyond this cluster, the relationship becomes more continuously increasing, with visible local plateaus/steps (e.g., clustering around Y≈1,614,335,300–1,779,000,000 bands), hinting at regime-like jumps rather than smooth linear growth. This structure would inflate the linear r² artificially, since the "floor" cluster contributes many points with near-zero residual Y-variance regardless of X.
4. Confounding factors and caveats
Given the dataset descriptions, X is a Bitcoin/USDT timestamp-linked feature while Y is labeled as an Ethereum "High" price column — but Y's dataset description text actually describes Bitcoin OHLCV data, indicating a likely label/metadata mismatch between the two datasets. Because both series are cryptocurrency price/time-indexed data spanning 2017–2026, the correlation is very plausibly driven by a shared underlying trend (both assets trending upward over a multi-year bull period) rather than any direct causal or mechanistic link — a classic case of spurious correlation via co-trending time series. Additionally, the flat-floor cluster suggests possible data quality issues (padding, missing-value imputation, or a fixed early period before real values existed).
5. Actionable insights
Before drawing conclusions, clarify the axis metadata to confirm what X and Y truly represent, and investigate the flat-floor cluster to determine if those rows are legitimate observations or artifacts that should be filtered out. Given the lack of Granger causality, this correlation should not be used for lead-lag trading or forecasting purposes; instead, consider testing for cointegration (common with two independently trending series) or de-trending both variables via differencing/returns before re-assessing the relationship. A segmented or piecewise regression (separating the flat region from the upward-sloping region) would likely yield a more accurate and interpretable model than the single linear fit currently reported.
X dataset: CryptoDataDownload – Binance BTC/USDT Daily OHLCV
Y dataset: Ethereum Historical Data (Daily)
Part of experiment: Bitcoin - CryptoDataDownload – Binance BTC/USDT Daily OHLCV vs Ethereum Historical Data (Daily)