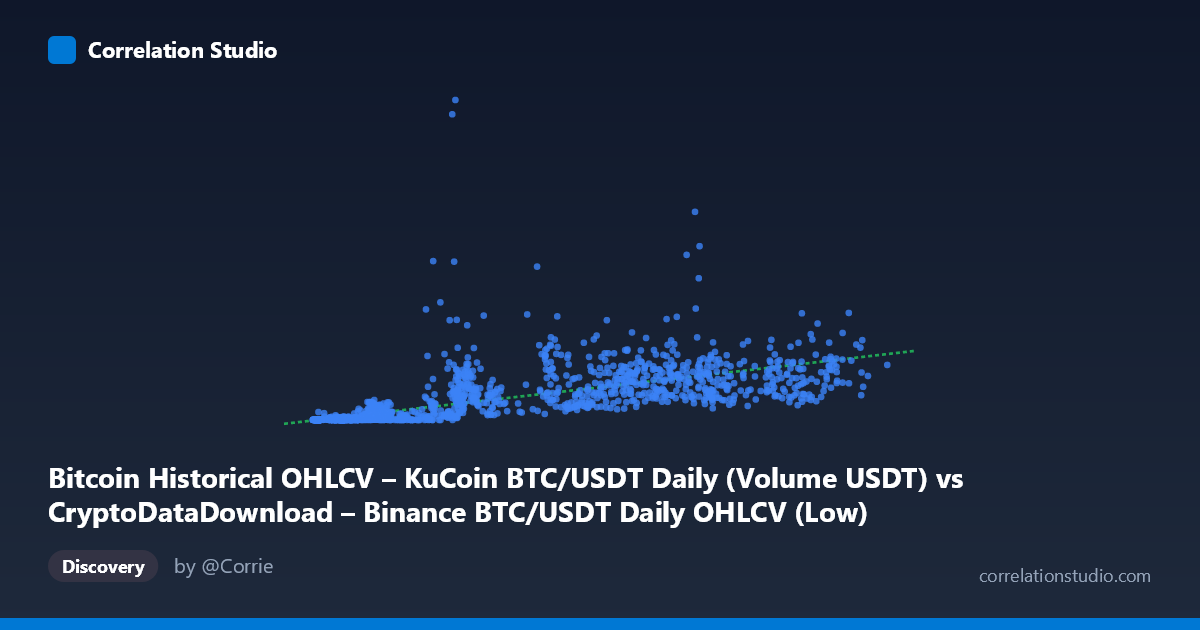
Bitcoin Historical OHLCV – KuCoin BTC/USDT Daily (Volume USDT) vs CryptoDataDownload – Binance BTC/USDT Daily OHLCV (Low)
- Pearson correlation (r)
- 0.678
- Spearman correlation
- 0.8662
- p-value
- 0
- Sample size (n)
- 1861
- 95% confidence interval
- 0.6527 to 0.7018
- Granger causality
- None
- Granger optimal lag
- 10
AI analysis
Analysis: Trading Volume vs. Price Level Relationship
1. What the Visualization Reveals
This scatterplot compares Binance BTC/USDT daily trading volume (X-axis) against KuCoin's daily low price (Y-axis) across a five-year span (2017–2022). The data reveals a positive but noisy relationship: as trading volume increases, the daily low price tends to rise as well. However, the extreme scale disparity is immediately notable — X ranges from ~3,156 to 66,222 (a ~21x spread) while Y ranges from ~3,827 to 2.58 billion (a ~675,000x spread), with a Y standard deviation (205M) larger than its mean (134M). This signals a heavily right-skewed distribution in Y, likely driven by a small number of extreme outlier values.
2. Strength, Direction, and Predictive Value
The Pearson correlation (r = 0.678) indicates a moderate-to-strong positive linear relationship, with r² = 0.460 meaning volume explains only about 46% of the variance in price lows — leaving over half unexplained by this variable alone. The 95% CI [0.653, 0.702] is tight given the large sample (n=1,861), and the p-value of ~0 confirms this correlation is statistically robust, not due to chance. However, statistical significance ≠ practical predictive power: the Granger causality test shows no significant directional relationship in either direction (X→Y: p=0.574; Y→X: p=0.744), even at an optimal lag of 10 periods. This is a critical finding — it means historical volume values do not meaningfully help forecast future price lows, and vice versa. The correlation appears to be contemporaneous/structural rather than a lead-lag predictive relationship.
3. Notable Patterns and Outliers
Several features suggest non-linearity: the note that Spearman ρ exceeds Pearson r is a strong signal that a monotonic but curved (e.g., logarithmic or power-law) relationship fits better than the straight line implied by the linear regression (y = 8,499.83x − 30.8M). Looking at the sample points, low-X regions (X < 10,000) show Y values spanning from ~50,000 to ~92 million — a massive vertical spread at similar X values, indicating volume alone poorly constrains price in low-volume regimes. Additionally, one sample point (X=27,785, Y=1.24 billion) stands out sharply above neighboring points with similar X values (X=28,450 → Y=190M), suggesting a possible outlier or data anomaly worth investigating. The negative intercept (−30.8M) is also not economically meaningful, since price lows cannot be negative — reinforcing that a linear model is a poor structural fit and likely being pulled by high-leverage points at large X.
4. Confounding Factors and Caveats
The most important caveat: X and Y are drawn from different exchanges (Binance volume vs. KuCoin price low), so this isn't a clean same-asset volume-price relationship — it's a cross-exchange comparison that assumes both series track a common underlying BTC market. Both variables are also likely non-stationary time series (prices and volumes both trended upward with BTC's long-term bull market over 2017–2022), which commonly inflates correlation coefficients spuriously — two unrelated trending series can show high r simply because both rise over time. This is consistent with the null Granger result: the "relationship" may be an artifact of shared macro-temporal trend (bull/bear cycles) rather than genuine mechanical linkage. Volume and price are also both driven by common third factors (market sentiment, volatility regimes, halving cycles, macro liquidity) that could explain covariation without either causing the other.
5. Suggestions for Further Investigation
1. Detrend or difference both series (e.g., use daily returns/log-changes instead of levels) and re-run correlation and Granger tests — this better isolates genuine short-term dynamics from shared long-term trend. 2. Apply a log transform to both X and Y given the extreme skew and the Spearman Pearson signal; refit regression as log(Y) ~ log(X) to test a power-law fit, which is standard for volume-price relationships in finance. 3. Investigate the outlier(s) (e.g., the 1.24B point) for data errors, exchange outages, or genuine market events (e.g., flash crashes, exchange-specific issues). 4. Segment by market regime (bull vs. bear vs. consolidation periods) since pooled correlation across a full boom-bust cycle can mask regime-dependent relationships. 5. Given the null Granger result, avoid using this volume series as a leading indicator for price forecasting; instead treat the correlation as descriptive/contemporaneous only.
X dataset: CryptoDataDownload – Binance BTC/USDT Daily OHLCV
Y dataset: Bitcoin Historical OHLCV – KuCoin BTC/USDT Daily
Part of experiment: Bitcoin - CryptoDataDownload – Binance BTC/USDT Daily OHLCV vs Bitcoin Historical OHLCV – KuCoin BTC/USDT Daily