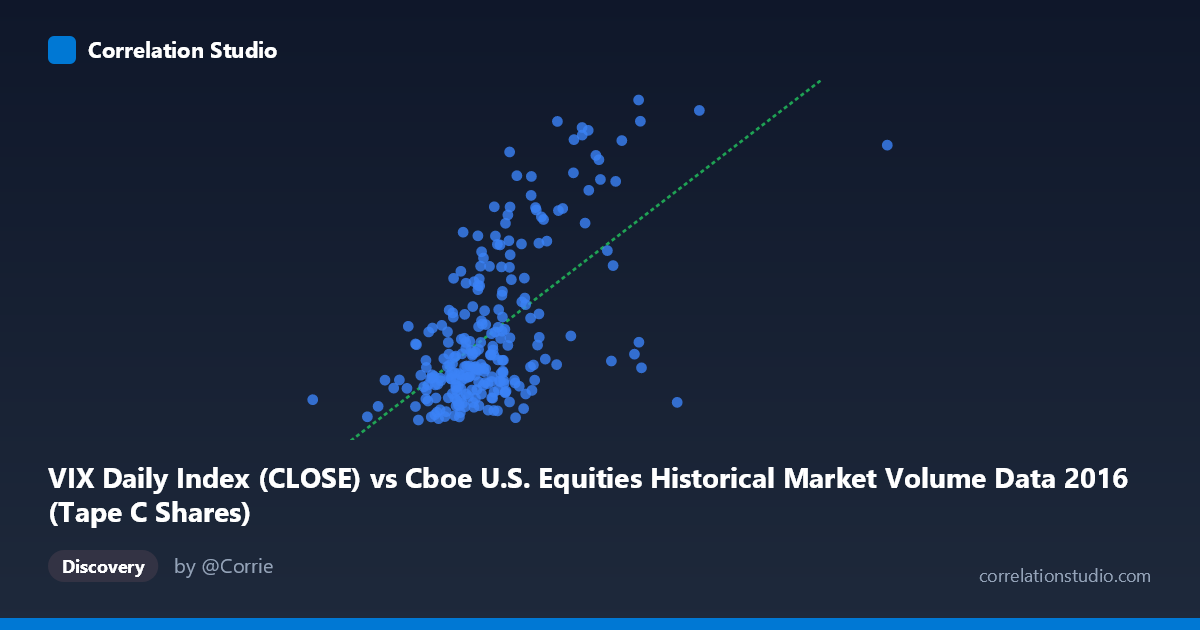
VIX Daily Index (CLOSE) vs Cboe U.S. Equities Historical Market Volume Data 2016 (Tape C Shares)
- Pearson correlation (r)
- 0.6028
- Spearman correlation
- 0.5216
- p-value
- 0
- Sample size (n)
- 252
- 95% confidence interval
- 0.5179 to 0.6761
- Granger causality
- None
- Granger optimal lag
- 1
AI analysis
Scatterplot Analysis: VIX vs. Tape C Shares Volume (2016)
Relationship Overview The scatterplot reveals a moderately positive relationship between Cboe U.S. Equities market volume (Tape C Shares, on the X-axis) and the VIX Daily Index close (Y-axis) across 252 trading days in 2016. As trading volume increases, VIX levels tend to rise correspondingly, which aligns intuitively with market intuition: periods of elevated uncertainty and fear tend to drive both higher volatility readings and increased trading activity. The linear regression equation (y = 8.79e-08x + 4.14) confirms this positive slope, though the relatively small coefficient reflects the vast scale difference between the two variables.
Correlation Strength and Statistical Significance The Pearson correlation of r = 0.60 indicates a moderate positive association. More precisely, r² = 0.363, meaning that approximately 36.3% of the variance in VIX is statistically explained by Tape C Share volume — leaving nearly two-thirds of VIX variation unaccounted for by volume alone. The 95% confidence interval of [0.518, 0.676] is meaningfully bounded away from zero, and the p-value of effectively 0 confirms this is not a chance finding given n = 252. However, the Granger causality tests tell a critical story: neither direction (X→Y: F = 0.0009, p = 0.976; Y→X: F = 0.120, p = 0.729) approaches significance. This means that neither variable temporally predicts the other — volume does not lead VIX and VIX does not lead volume. The relationship is contemporaneous rather than predictive, significantly limiting its utility for forecasting.
Notable Patterns, Clusters, and Outliers The bulk of observations cluster in a dense core between approximately 100–140M shares and VIX levels of 12–18, suggesting that routine trading days operate within a stable, compressed regime. However, several notable high-leverage outliers are visible in the upper-right region of the chart — points such as (175M shares, VIX ~26.7) and (166M shares, VIX ~22.4) stand out dramatically from the main cluster, likely corresponding to specific volatility events in 2016 (e.g., Brexit in late June, the U.S. presidential election in November). These outliers exert disproportionate influence on the regression line and likely inflate the correlation coefficient. There also appears to be a non-linear threshold effect: below ~120M shares, VIX values remain consistently low, while above ~140M shares, the dispersion in VIX widens considerably, hinting at a possible regime-change dynamic rather than a simple linear relationship.
Confounding Factors and Caveats Several important caveats apply. First, reverse causality and simultaneity are plausible — spikes in VIX may attract options traders and algorithmic activity that itself drives volume, creating a feedback loop that neither Granger direction can isolate. Second, omitted variables such as macroeconomic announcements, Federal Reserve communications, geopolitical shocks (Brexit, election), and options expiration calendars likely drive both variables simultaneously, inflating the observed correlation without implying a structural relationship. Third, Tape C specifically reflects NYSE Arca-listed securities and may not uniformly represent broader market activity, introducing selection bias. Finally, the population size of N = 3,622 versus the sample of n = 252 suggests the full dataset may reveal different dynamics — the sampled year (2016) was unusually event-rich, potentially overstating a relationship that would be weaker in calmer market environments.
Actionable Insights and Further Investigation Despite the absence of Granger causality, the contemporaneous correlation is strong enough to warrant deeper investigation. Practitioners should consider: (1) segmenting the data by market regime (low/high VIX quartiles) to test whether the relationship strengthens nonlinearly under stress conditions; (2) incorporating lagged macroeconomic event indicators as controls to partial out confounding shocks; (3) testing whether options volume or put/call ratios mediate the relationship more cleanly than equity share volume; and (4) extending the analysis across multiple years to determine whether 2016's event-driven calendar artificially inflates the correlation. A quantile regression or threshold regression approach would be particularly valuable given the apparent heteroskedasticity in the scatter, where variability in VIX expands sharply at higher volume levels.
X dataset: Cboe U.S. Equities Historical Market Volume Data 2016
Y dataset: VIX Daily Index
Part of experiment: Daily - Cboe U.S. Equities Historical Market Volume Data 2016 vs VIX Daily Index