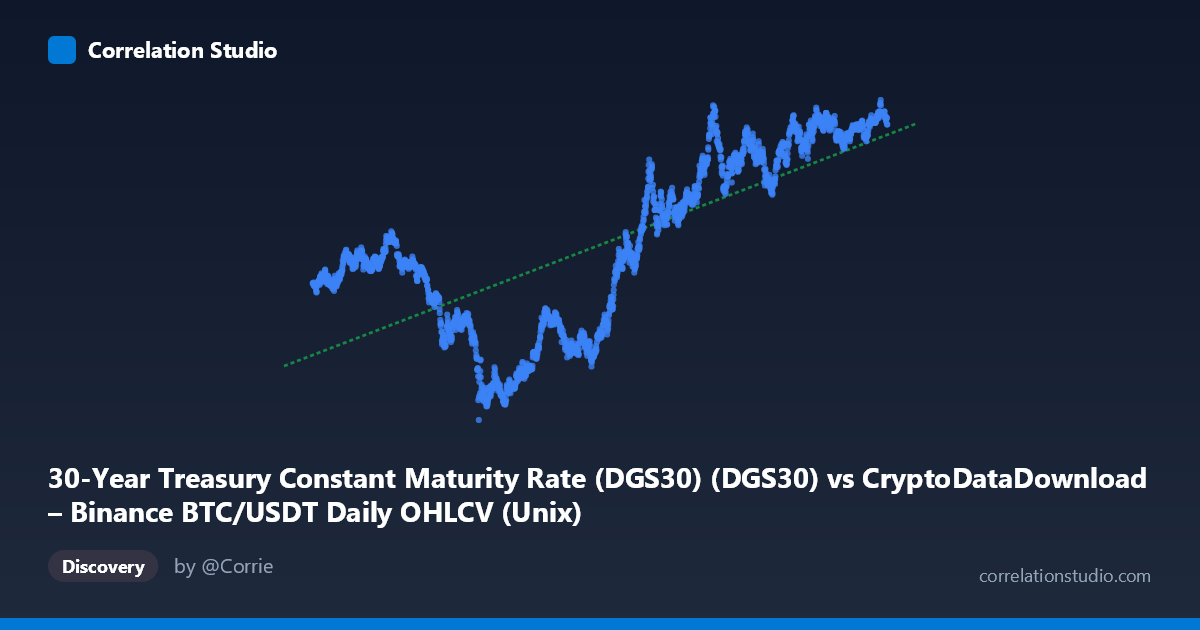
30-Year Treasury Constant Maturity Rate (DGS30) (DGS30) vs CryptoDataDownload – Binance BTC/USDT Daily OHLCV (Unix)
- Pearson correlation (r)
- 0.7312
- Spearman correlation
- 0.72
- p-value
- 0
- Sample size (n)
- 2197
- 95% confidence interval
- 0.7111 to 0.7501
- Granger causality
- None
- Granger optimal lag
- 1
AI analysis
Analysis: 30-Year Treasury Yield vs. Time (mislabeled as BTC/USDT relationship)
Important note on data labeling: The axis labels appear swapped or mismatched — the X-axis is described as the Treasury rate while its values are clearly Unix timestamps (ranging 2017–2026), and Y-axis values (0.99–5.18) look like actual yield percentages. This analysis treats X as time and Y as the 30-Year Treasury yield, which is consistent with the actual data pattern (a long-term rate trend rather than a rate-vs-price scatter).
1. What the Visualization Reveals The scatterplot shows a clear long-term upward trend in the 30-year Treasury yield from 2017 through mid-2026. Early sample points (2017–2020) cluster in the 1.3–2.8% range, while later points (2023–2026) cluster tightly between 4.0–5.0%. This is consistent with the well-known macro narrative: yields bottomed near zero during the 2020 pandemic easing cycle, then rose sharply during the 2022–2023 Fed hiking cycle, and have since stabilized at elevated levels.
2. Strength, Direction, and Statistical Confidence The correlation (r = 0.731) is strong and positive, with R² = 0.535 indicating that roughly 53% of the variance in yield levels is explained by time alone — a substantial share, though nearly half the variance remains unexplained by a simple linear time trend. The 95% CI [0.711, 0.750] is tight given the large sample (n=2,197), and p≈0 confirms this relationship is not due to chance. However, the Granger causality tests show no significant predictive direction (X→Y p=0.23, Y→X p=0.18), meaning that in a lagged time-series sense, neither variable meaningfully forecasts the other at lag 1. This is expected and unsurprising when one "variable" is literally time/date — Granger causality is testing autocorrelation structure, not a genuine causal relationship between two independent economic signals.
3. Notable Patterns and Non-linearities The relationship is clearly non-linear — it resembles a step/S-curve rather than a straight line: a slow, low-yield plateau (2017–2020), a steep rise (2021–2023), and a high-yield plateau/consolidation (2023–2026). A simple linear fit (R²=0.535) understates the true fit quality of a piecewise or logistic-style model. Sample points also show local reversals (e.g., dips to ~3.5–3.6% amid a generally rising 2022–2024 trend), reflecting real rate-cycle volatility (Fed pauses, recession fears, flight-to-safety episodes) rather than measurement noise.
4. Confounding Factors and Caveats Since this is fundamentally a time trend, the "correlation" mostly reflects a shared macro regime shift (post-pandemic inflation and Fed tightening) rather than a bivariate causal relationship between two independent series. Key caveats: (a) treasury yields are influenced by inflation prints, Fed policy, fiscal issuance, and global demand for safe assets — none of which are captured here; (b) the metadata mismatch suggests possible data pipeline errors that should be resolved before drawing further conclusions; (c) daily yield data has strong autocorrelation, violating independence assumptions behind standard p-value calculations, likely inflating apparent significance.
5. Recommendations for Further Investigation - Fix axis labeling to confirm what is actually being compared (time vs. yield, or the originally intended BTC/USDT vs. DGS30 relationship). - If the intended analysis was BTC/USDT price vs. Treasury yield, that comparison should be rerun with correct data alignment — this would be far more economically interesting (e.g., testing whether rising long-term rates dampen speculative crypto demand). - Model the yield series with a piecewise linear, spline, or logistic curve instead of simple OLS to better capture the regime shift around 2022. - Test for stationarity and cointegration (e.g., ADF, Engle-Granger) rather than relying on raw Granger F-tests, given both series are likely non-stationary trends. - Incorporate macro covariates (CPI, Fed funds rate, real GDP growth) to explain the yield trajectory more directly than time alone.
X dataset: CryptoDataDownload – Binance BTC/USDT Daily OHLCV
Y dataset: 30-Year Treasury Constant Maturity Rate (DGS30)
Part of experiment: Bitcoin - CryptoDataDownload – Binance BTC/USDT Daily OHLCV vs 30-Year Treasury Constant Maturity Rate (DGS30)