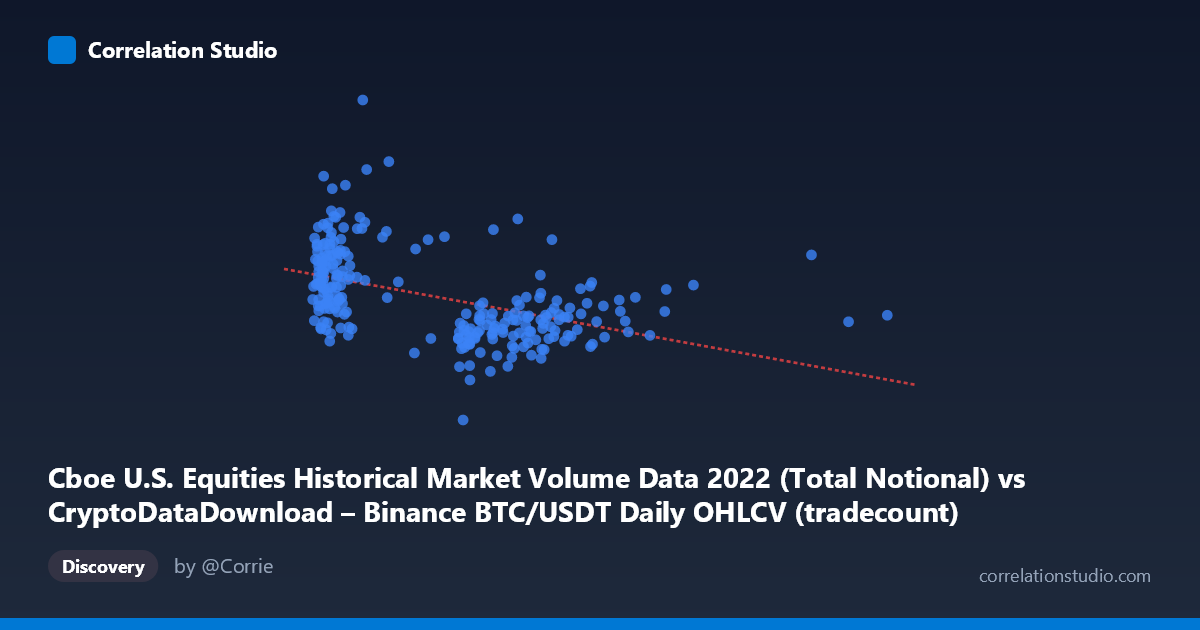
Cboe U.S. Equities Historical Market Volume Data 2022 (Total Notional) vs CryptoDataDownload – Binance BTC/USDT Daily OHLCV (tradecount)
- Pearson correlation (r)
- -0.4696
- Spearman correlation
- -0.5022
- p-value
- 0
- Sample size (n)
- 251
- 95% confidence interval
- -0.5608 to -0.3672
- Granger causality
- None
- Granger optimal lag
- 10
- Time coverage
- 2022-01-03 to 2022-12-30
AI analysis
Analysis: BTC/USDT Volume vs. Cboe U.S. Equities Trade Count (2022)
1. Relationship Overview
The scatterplot shows a moderate negative, non-linear relationship between the two variables. At low X values (roughly 800,000–2,500,000), Y values are highly dispersed, ranging from ~24 billion to over 51 billion — indicating substantial variance not explained by X at this end of the range. As X increases beyond ~4,000,000, the relationship tightens considerably, with Y values clustering more narrowly between ~21–27 billion. This pattern suggests a curved (possibly logarithmic or power-law decay) relationship rather than a strictly linear one, with the linear fit likely understating the true structure at low X values.
2. Strength, Direction, and Statistical Confidence
The correlation coefficient (r = -0.4696) indicates a moderate negative relationship, meaning that as X increases, Y tends to decrease. However, r² = 0.2205 reveals that only about 22% of the variance in Y is explained by X — the majority (78%) is driven by other factors or noise. The 95% CI [-0.5608, -0.3672] is reasonably tight and does not cross zero, and the extremely small p-value (3.55E-15) confirms this correlation is statistically robust and not due to chance, despite its modest strength. Critically, the Granger causality tests show no significant predictive direction in either direction (X→Y: p=0.101; Y→X: p=0.459) at the optimal lag of 10 periods. This means that despite the contemporaneous correlation, neither variable reliably predicts future values of the other — the relationship is associative, not (Granger-)causal in a temporal/predictive sense.
3. Notable Patterns and Outliers
Several high-leverage points stand out: values like (1065054, 50.1B), (1271128, 48.0B), and (2092561, 51.2B) sit well above the general trend at low X, pulling the linear slope steeper than the bulk of the data would suggest. Conversely, the dense cluster at X 4,000,000 shows Y compressing into a tight band around 22–27 billion, suggesting a possible floor or saturation effect at higher X values. This heteroscedasticity (uneven spread of residuals across X) violates a key assumption of simple linear regression and suggests a transformation (log-X or a reciprocal model) might fit better than the linear specification.
4. Confounding Factors and Caveats
Both series are daily time series from 2022, a year marked by significant macro volatility (crypto market crash, Fed rate hikes, equity market drawdowns). This raises strong concern for spurious correlation driven by shared temporal trends — both crypto trading volume and equity trade counts may have independently declined or fluctuated due to common macro drivers (risk-off sentiment, reduced retail participation, seasonality) rather than any direct causal link between Binance BTC volume and Cboe equities trade count. The lack of Granger causality reinforces that this is likely a co-movement/confounding scenario rather than a genuine predictive relationship. Additionally, comparing a crypto exchange's trading volume to a traditional equities venue's trade count is comparing different market structures (24/7 crypto vs. session-based equities), which may introduce alignment/timestamp mismatches.
5. Suggested Next Steps
To clarify the relationship, consider: (1) testing log or rank-transformed variables to address the apparent non-linearity and heteroscedasticity; (2) controlling for common macro confounders (e.g., VIX, overall market volatility index, or S&P 500 returns) via partial correlation or multivariate regression; (3) segmenting the analysis by market regime (bull vs. bear periods in 2022) to see if the relationship strengthens or reverses; and (4) given the Granger results, avoid using either series to forecast the other — instead, treat the correlation as descriptive/contemporaneous only, and investigate whether both are jointly driven by a third latent factor such as overall market liquidity or risk sentiment.
X dataset: CryptoDataDownload – Binance BTC/USDT Daily OHLCV
Y dataset: Cboe U.S. Equities Historical Market Volume Data 2022
Part of experiment: Bitcoin - CryptoDataDownload – Binance BTC/USDT Daily OHLCV vs Cboe U.S. Equities Historical Market Volume Data 2022