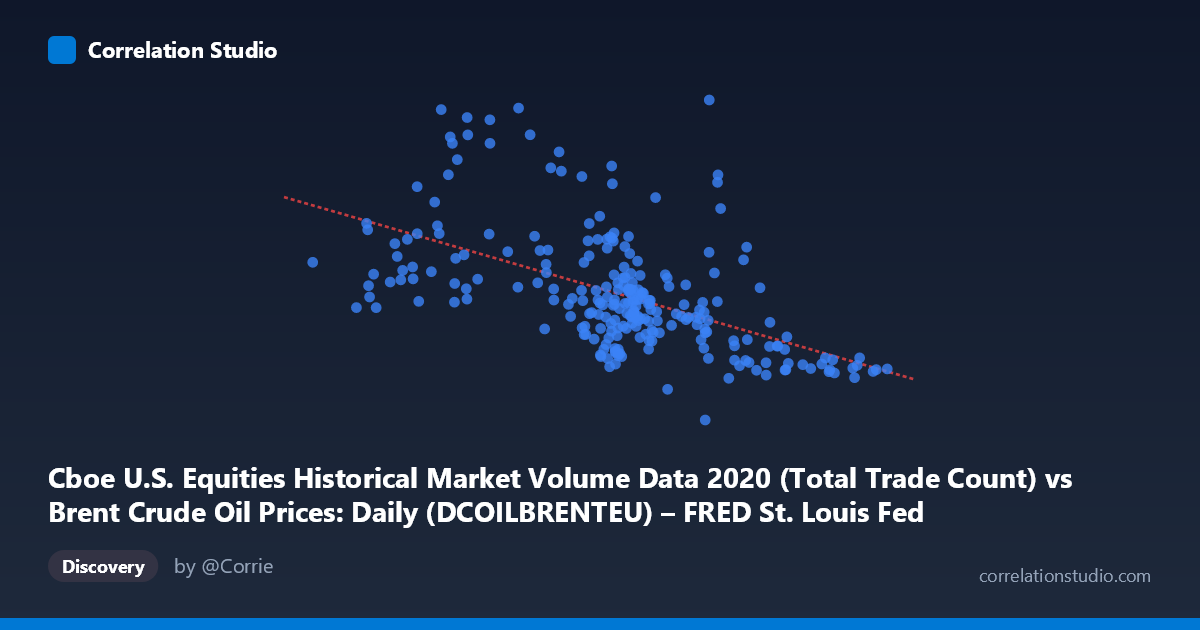
Cboe U.S. Equities Historical Market Volume Data 2020 (Total Trade Count) vs Brent Crude Oil Prices: Daily (DCOILBRENTEU) – FRED St. Louis Fed (DCOILBRENTEU)
- Pearson correlation (r)
- -0.5445
- Spearman correlation
- -0.5903
- p-value
- 0
- Sample size (n)
- 250
- 95% confidence interval
- -0.6263 to -0.4509
- Granger causality
- None
- Granger optimal lag
- 10
AI analysis
Analysis: Cboe U.S. Equities Trade Count vs. Brent Crude Oil Price (2020)
Relationship Overview The scatterplot reveals a moderate negative relationship between U.S. equities total trade count (X) and Brent Crude Oil prices (Y) across 2020. The linear regression equation (y = −42,089.3x + 5,268,680) indicates that for every one-unit increase in trade count, Brent crude prices decline by approximately $42,089 on average. Visually, higher trade counts cluster toward lower oil price values, while lower trade counts are associated with a broader, elevated range of oil prices — though with considerable dispersion throughout the plot. The relationship, while discernible, is far from deterministic, with substantial scatter around the regression line.
Correlation Strength, Direction, and Statistical Framing The Pearson correlation of r = −0.5445 confirms a moderate negative association. However, the R² of 0.2965 is the more sobering metric: trade count explains only ~29.7% of the variance in Brent crude prices, meaning roughly 70% of price variability is driven by other factors entirely. The 95% confidence interval of [−0.6263, −0.4509] is meaningfully tight and entirely negative, confirming the direction is reliable and not an artifact of sampling — this is reinforced by a p-value effectively at zero across a population of N = 4,254. That said, statistical significance at this scale does not imply practical significance or causation. Critically, Granger causality tests find no significant predictive directionality in either direction (X→Y: F = 0.629, p = 0.788; Y→X: F = 0.506, p = 0.885) at the optimal 10-period lag. This means that despite the contemporaneous correlation, neither variable meaningfully predicts the other temporally — the relationship does not operate as a leading indicator in either direction.
Notable Patterns, Clusters, and Outliers Several structural features stand out in the data. A distinct cluster of points exists at lower X values (trade counts roughly 15–30 range) that spans a wide Y range, including several notably elevated oil price values above 4,000,000–5,700,000 — suggesting early-2020 or late-2020 periods when trading volumes were lower but oil prices varied dramatically. Conversely, higher trade counts (55–70 range) are almost exclusively associated with lower oil prices (below ~2,800,000), consistent with the volatile March–April 2020 oil price collapse coinciding with COVID-driven equity market turbulence and record trading activity. One conspicuous outlier near (35.33, 5,713,160) sits far above the regression line and warrants individual inspection — this may correspond to a specific date with anomalously high oil prices relative to trade count. The point (67.05, 2,407,246) anchors the high-volume, low-price extreme and likely reflects the April 2020 oil price crash period.
Confounding Factors and Interpretive Caveats The 2020 timeframe is deeply problematic for causal interpretation. The COVID-19 pandemic simultaneously caused equity market volatility (spiking trade counts) and an unprecedented oil price collapse (including negative WTI prices in April 2020), meaning both variables were being jointly driven by the same exogenous shock rather than influencing each other. This classic common-cause confounding likely inflates the observed correlation substantially. Additionally, the axes appear mislabeled in the dataset description — the X variable is described as trade count data from a Brent crude dataset file, and vice versa, suggesting a dataset column assignment issue that warrants verification before drawing conclusions. Seasonality, OPEC production decisions, geopolitical events, and USD strength are all independent drivers of oil prices that could produce spurious correlations with any high-frequency financial variable during 2020.
Actionable Insights and Further Investigation Given the lack of Granger causality, neither variable should be used as a predictive signal for the other in trading or forecasting models without further justification. To disentangle the COVID confound, analysis should be stratified by time period (pre-COVID baseline vs. March–June 2020 shock vs. recovery) to assess whether the correlation holds outside the crisis window. Incorporating VIX (volatility index) as a control variable would help determine whether the correlation dissolves once market stress is accounted for. The outlier near (35.33, 5,713,160) should be date-identified and investigated for data quality or event-specific drivers. More broadly, a multivariate regression incorporating macroeconomic controls (USD index, equity market returns, OPEC announcements) would clarify whether trade count retains any independent explanatory power for oil prices, or whether its role is entirely mediated by the shared COVID shock.
X dataset: Brent Crude Oil Prices: Daily (DCOILBRENTEU) – FRED St. Louis Fed
Y dataset: Cboe U.S. Equities Historical Market Volume Data 2020
Part of experiment: Daily - Brent Crude Oil Prices: Daily (DCOILBRENTEU) – FRED St. Louis Fed vs Cboe U.S. Equities Historical Market Volume Data 2020