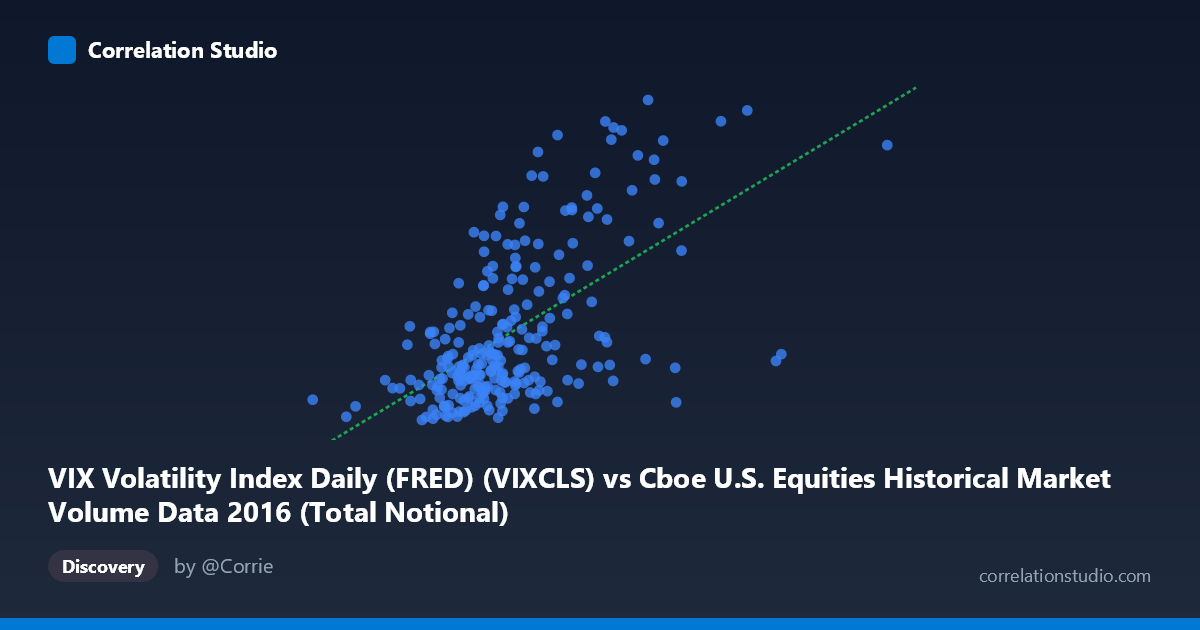
VIX Volatility Index Daily (FRED) (VIXCLS) vs Cboe U.S. Equities Historical Market Volume Data 2016 (Total Notional)
- Pearson correlation (r)
- 0.5882
- Spearman correlation
- 0.5462
- p-value
- 0
- Sample size (n)
- 252
- 95% confidence interval
- 0.5011 to 0.6636
- Granger causality
- None
- Granger optimal lag
- 1
AI analysis
Analysis: VIX Volatility Index vs. U.S. Equity Market Total Notional Volume (2016)
Relationship Overview
The scatterplot reveals a moderate positive relationship between U.S. equity market total notional trading volume (X-axis) and the VIX Volatility Index (Y-axis) across 252 trading days in 2016. As market notional volume increases, implied volatility as measured by VIX tends to rise as well. This aligns with financial intuition: periods of heightened fear or uncertainty typically drive both elevated options-implied volatility and surges in equity trading activity, as market participants react to perceived risk by adjusting positions more aggressively. The linear regression equation (y = 5.49×10⁻¹⁰x + 5.39) confirms a small but meaningful positive slope across the observed range.
Correlation Strength and Statistical Significance
The Pearson correlation of r = 0.5882 indicates a moderate positive association, but the explanatory power deserves careful framing: r² = 0.346 means only 34.6% of variance in VIX is explained by notional volume, leaving roughly 65% attributable to other factors. The 95% confidence interval of [0.501, 0.664] is reasonably tight and sits entirely above zero, and the p-value of effectively 0 (against a population of N = 3,622) confirms this relationship is highly unlikely to be a statistical artifact. However, Granger causality tests find no significant temporal predictive direction in either direction — neither X→Y (F = 0.152, p = 0.697) nor Y→X (F = 0.605, p = 0.437) achieves significance at lag-1. This is a critical nuance: while the variables are meaningfully correlated contemporaneously, neither reliably predicts the other on the following day, suggesting they respond to common shocks simultaneously rather than one leading the other.
Notable Patterns, Clusters, and Outliers
The data exhibits a distinct cluster of low-volume, low-VIX days concentrated roughly between 14–19 billion in notional volume and VIX values of 11–16, reflecting typical calm market conditions that dominated much of 2016. Above approximately 21–22 billion in volume, the scatter fans out considerably with higher VIX values, suggesting increasing variance at elevated activity levels — a pattern consistent with heteroscedasticity. Several notable outliers are visible in the upper-right quadrant, including observations near (25.1B, 26.7), (24.1B, 22.4), and (25.1B, 26.7), which likely correspond to specific volatility events such as the Brexit vote (June 2016) or the U.S. presidential election (November 2016). These high-leverage points may be disproportionately inflating the correlation coefficient, and their removal could substantially weaken the observed r value.
Confounding Factors and Caveats
Several confounders complicate a straightforward causal interpretation. Most importantly, both variables are likely jointly driven by macro-level shock events — geopolitical surprises, Federal Reserve announcements, or earnings seasons — rather than one causing the other, which the failed Granger tests support directly. The VIX is a forward-looking implied volatility measure derived from options prices, while notional volume is a realized trading activity metric; they operate on different timescales and mechanisms. Additionally, structural features of 2016 specifically (a U.S. election year with multiple high-uncertainty episodes) may have produced an unusually strong coupling that would not generalize to other years. The dataset's single-year scope (January–December 2016) also limits external validity, and the absence of day-of-week or intraday controls means systematic calendar effects could be contributing noise.
Actionable Insights and Further Investigation
Practitioners and researchers should avoid using lagged notional volume as a standalone predictor of next-day VIX given the Granger causality findings — any trading strategy or risk model built on that premise would lack empirical support. A more productive direction would be to introduce event-flagging variables (FOMC dates, earnings windows, major political events) to test whether the correlation is driven almost entirely by a handful of shock days. Statistically, testing for non-linear or threshold effects (e.g., spline regression or quantile regression) would help characterize the apparent heteroscedasticity and fan-shaped scatter. Expanding the time horizon to multiple years would clarify whether the 2016 relationship is structurally stable or episodic. Finally, decomposing notional volume by exchange type or asset class could reveal whether specific market segments (e.g., options volume specifically) carry stronger predictive signal for VIX movements than aggregate equities volume does.
X dataset: Cboe U.S. Equities Historical Market Volume Data 2016
Y dataset: VIX Volatility Index Daily (FRED)
Part of experiment: Daily - Cboe U.S. Equities Historical Market Volume Data 2016 vs VIX Volatility Index Daily (FRED)