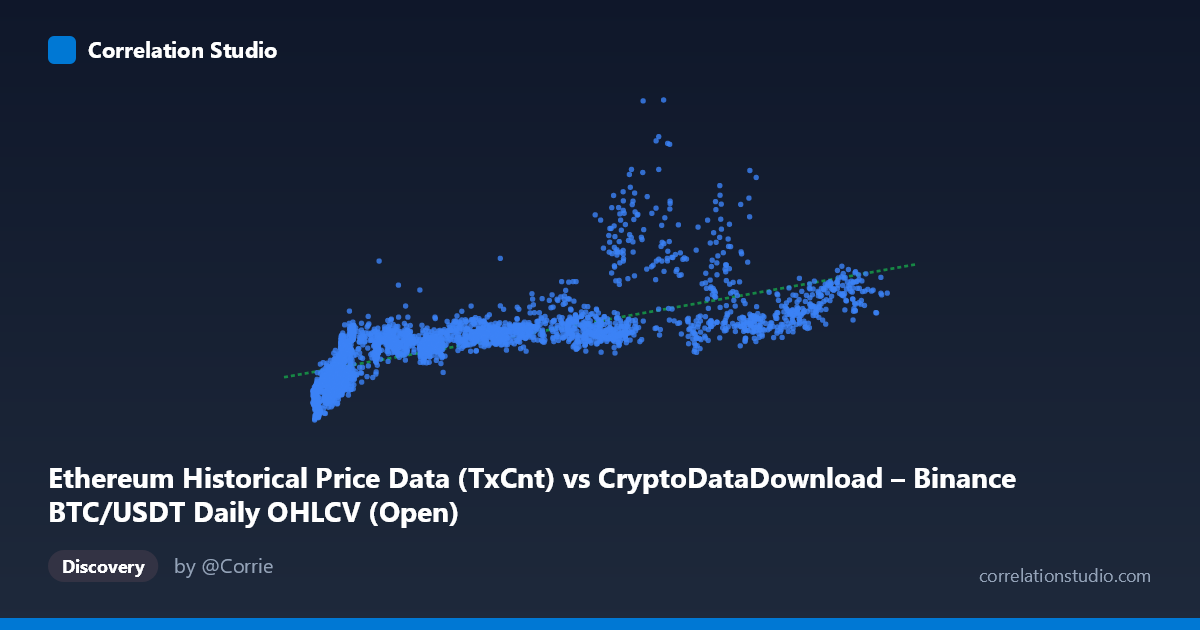
Ethereum Historical Price Data (TxCnt) vs CryptoDataDownload – Binance BTC/USDT Daily OHLCV (Open)
- Pearson correlation (r)
- 0.7297
- Spearman correlation
- 0.8813
- p-value
- 0
- Sample size (n)
- 3191
- 95% confidence interval
- 0.7131 to 0.7455
- Granger causality
- None
- Granger optimal lag
- 10
AI analysis
Analysis: Ethereum Transaction Count vs. Bitcoin Opening Price
1. Relationship Overview
The scatterplot depicts a moderate-to-strong positive relationship between Ethereum daily transaction count (X) and Bitcoin's daily opening price (Y) over an ~8.75-year window (2017–2026). Despite these being metrics from two different assets, they move together substantially — likely because both are driven by shared macro crypto-market cycles (bull/bear phases, liquidity conditions, retail participation) rather than a direct mechanical link. The mislabeled axis titles (X described as "Historical Price Data (TxCnt)" and Y as "Open") suggest this is effectively Ethereum network activity vs. Bitcoin price, a proxy relationship between on-chain usage and market valuation.
2. Strength, Direction, and Predictive Power
The Pearson correlation (r = 0.730, r² = 0.533) indicates a solid positive linear association, meaning roughly 53% of the variance in BTC's opening price can be statistically explained by ETH transaction counts — leaving nearly half the variance driven by other factors. The tight 95% CI [0.713, 0.746] and p ≈ 0 confirm this correlation is highly statistically reliable and not due to chance, given the large sample (n=3,191). However, statistical significance should not be conflated with causal or predictive utility: the Granger causality tests show no significant lead-lag relationship in either direction (X→Y p=0.41; Y→X p=0.62), even at an optimal lag of 10 periods. This means neither series reliably predicts future movements of the other — the correlation is likely coincidental co-movement from shared external drivers (e.g., overall crypto sentiment), not one variable causing or forecasting the other.
3. Patterns and Non-linearity
The data shows a rough fan/wedge shape: at low ETH transaction counts (~3,000–15,000), BTC prices cluster tightly in a lower band (~$300K–$1.1M), while at higher transaction counts (~60,000–125,000), BTC prices spread more widely, including high outliers (e.g., ~$2.4M–2.9M at TxCnt ~68,000–76,000). This fan pattern and the note that Spearman ρ Pearson r both suggest the true relationship is non-linear — possibly logarithmic or power-law, consistent with typical crypto asset behavior where percentage moves matter more than absolute ones. A log-log or log-linear transformation would likely tighten the fit and better capture diminishing returns at high transaction volumes.
4. Confounding Factors and Caveats
Several caveats limit causal interpretation: - Shared market regime confounding: Both series are likely driven by common macro factors (overall crypto adoption cycles, Fed policy, risk-on/risk-off sentiment) rather than reflecting a direct ETH→BTC or BTC→ETH mechanism. - Non-stationarity: Both price and usage metrics tend to trend over time (especially across an 8-year window spanning multiple bull/bear cycles), which can inflate correlation via mutual drift even absent genuine dependence — this is a classic spurious-regression risk in time series. - Scale mismatch: Transaction counts (an activity metric) and USD price (a valuation metric) aren't naturally commensurate; the linear regression slope (8.89) has limited economic interpretability. - Data mismatch: Population N (3,212) vs. paired sample n (3,191) indicates ~21 missing/misaligned records, and the dataset descriptions suggest label swapping/confusion between BTC and ETH series that should be verified before drawing conclusions.
5. Recommendations
- De-trend or difference both series (e.g., use daily % returns instead of levels) and re-run correlation/Granger tests to check if the relationship holds after removing shared trend — this is the standard fix for potential spurious correlation in trending time series. - Test non-linear/log transformations (log-log regression) given the Spearman-Pearson gap and fan-shaped residual spread. - Segment by market regime (bull vs. bear phases) to see if the correlation strength changes — shared-driver hypotheses predict correlation should spike during broad market rallies/crashes and weaken in sideways periods. - Given the null Granger causality result, avoid using ETH transaction count as a trading signal for BTC price (or vice versa) without further evidence; the current data supports co-movement, not prediction.
X dataset: CryptoDataDownload – Binance BTC/USDT Daily OHLCV
Y dataset: Ethereum Historical Price Data
Part of experiment: Bitcoin - CryptoDataDownload – Binance BTC/USDT Daily OHLCV vs Ethereum Historical Price Data