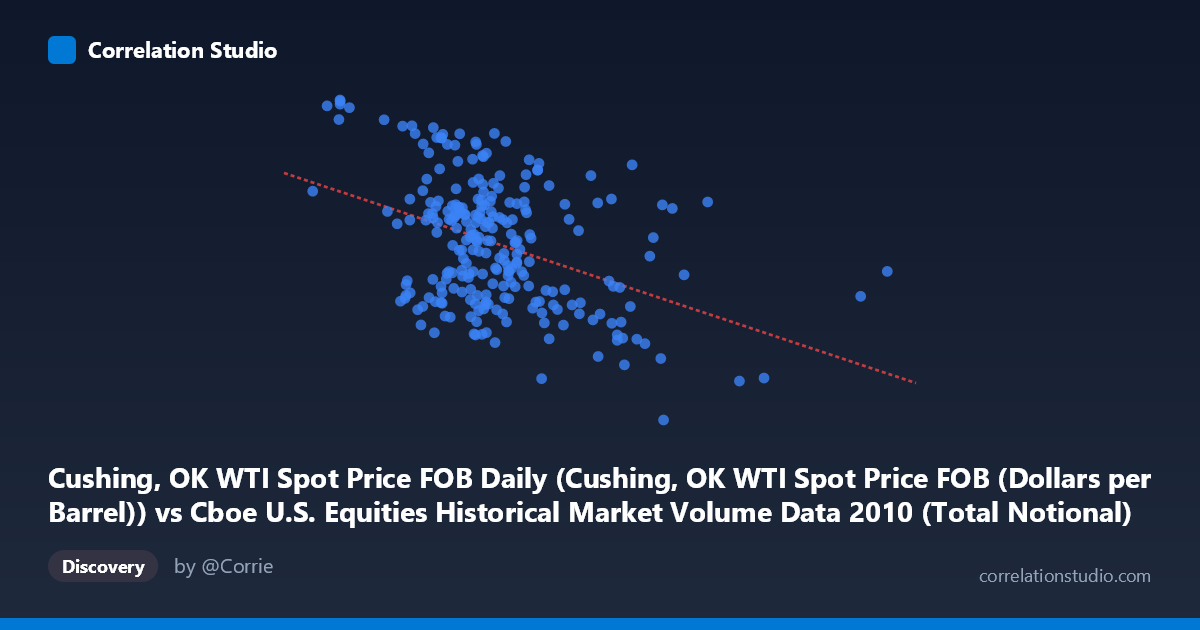
Cushing, OK WTI Spot Price FOB Daily (Cushing, OK WTI Spot Price FOB (Dollars per Barrel)) vs Cboe U.S. Equities Historical Market Volume Data 2010 (Total Notional)
- Pearson correlation (r)
- -0.4125
- Spearman correlation
- -0.3347
- p-value
- 0
- Sample size (n)
- 252
- 95% confidence interval
- -0.51 to -0.3044
- Granger causality
- Y → X
- Granger optimal lag
- 1
AI analysis
Analysis: WTI Crude Oil Prices vs. U.S. Equity Market Notional Volume (2010)
Relationship Overview
The scatterplot reveals a negative relationship between Cboe U.S. equity market total notional trading volume (X-axis) and WTI crude oil spot prices (Y-axis) across 252 trading days in 2010. As equity market notional volume increases, oil prices tend to decrease — a counterintuitive finding at first glance, but one that reflects the complex interplay between financial market activity and commodity pricing during the post-financial-crisis recovery period. The linear regression equation (y = -4.13E-10x + 86.98) confirms this downward slope, though the scatter is considerable, indicating that the relationship is real but far from deterministic.
Correlation Strength and Statistical Significance
The Pearson correlation of r = -0.4125 indicates a moderate negative association. However, the coefficient of determination r² = 0.1701 tells a more sobering story: only 17% of the variance in WTI oil prices is explained by equity market notional volume, leaving 83% attributable to other factors. The 95% confidence interval of [-0.51, -0.30] is entirely negative, confirming directional consistency, and the p-value of 9.03E-12 is extraordinarily small relative to the n=252 sample, making this correlation highly statistically significant — the signal is real, even if modest in practical magnitude. The Granger causality results add a critical temporal dimension: the analysis finds unidirectional causality where Y (oil prices) Granger-causes X (equity notional volume) at a 1-day lag (F=4.28, p=0.040), while the reverse direction (X→Y) fails to reach significance (F=0.89, p=0.346). This means oil price movements appear to predict subsequent equity trading volume, not the other way around — suggesting oil acts as a leading sentiment or volatility signal for equity market participants.
Notable Patterns, Clusters, and Outliers
Several features stand out in the sample data. There is a visible cluster of high-volume, lower-price observations in the upper-left X range (notional volumes above ~28–34 billion), consistently associated with oil prices in the 64–75 range — notably the points at (29.3B, 64.78), (34.4B, 68.03), and (42.6B, 75.10). These extreme-volume days appear to anchor the negative trend strongly. Conversely, lower-volume days (8–15 billion range) show considerably higher and more dispersed oil prices (74–91), including notable high-price outliers such as (8.24B, 90.84) and (10.57B, 89.83). The wide vertical spread at mid-range X values (~15–20 billion) — where oil prices range from roughly 72 to 89 — suggests that equity volume alone is a weak predictor in "normal" conditions. The single extreme outlier at ~42.5 billion notional volume likely represents an unusual market event (options expiration, a volatility spike, or a macro shock day) and may be disproportionately influencing the regression slope.
Confounding Factors and Caveats
Several important caveats limit causal interpretation. 2010 was a structurally unusual year — markets were recovering from the 2008–2009 financial crisis, with episodic volatility spikes (e.g., the May 2010 Flash Crash) artificially inflating equity notional volume on specific days, which could coincide with commodity market stress and lower oil prices. Equity notional volume is itself a composite metric aggregating many exchanges and TRFs, meaning it reflects broad market stress and algorithmic activity rather than directional positioning in oil. The Granger result, while statistically valid, operates at a 1-day lag and explains a small share of variance, so its practical trading utility is limited. Additionally, confounders such as the U.S. dollar index, macroeconomic data releases, Fed policy signals, and geopolitical events likely drive both variables simultaneously, creating spurious or partially spurious correlation without direct causal linkage.
Actionable Insights and Further Investigation
Given that oil prices Granger-cause equity volume — but not vice versa — risk managers and market microstructure researchers should investigate whether sharp oil price moves (particularly declines) reliably precede elevated equity trading volume the following day, potentially as a volatility transmission mechanism. Further analysis should segment the data by volatility regime (e.g., VIX quartiles) to test whether the negative correlation intensifies during high-volatility periods. It would also be valuable to isolate the Flash Crash period (May 6, 2010) and re-run the correlation to assess its outsized influence. Finally, extending this analysis to multiple years would clarify whether this relationship is a 2010-specific artifact of post-crisis dynamics or a persistent structural feature of the oil-equity nexus.
X dataset: Cboe U.S. Equities Historical Market Volume Data 2010
Y dataset: Cushing, OK WTI Spot Price FOB Daily
Part of experiment: Daily - Cboe U.S. Equities Historical Market Volume Data 2010 vs Cushing, OK WTI Spot Price FOB Daily