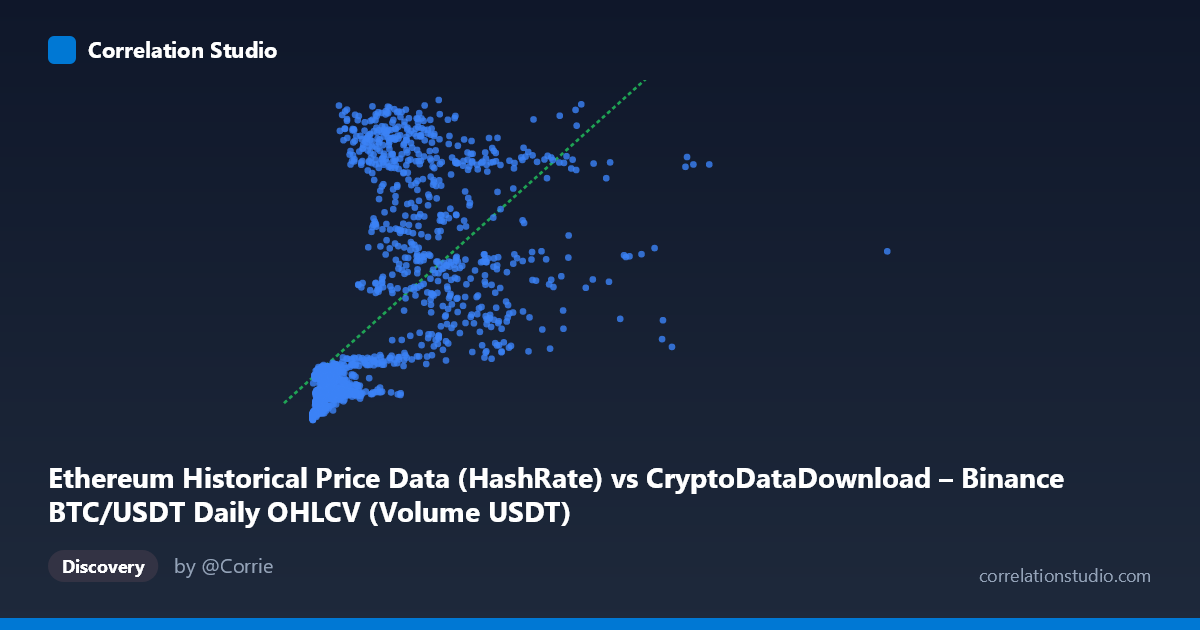
Ethereum Historical Price Data (HashRate) vs CryptoDataDownload – Binance BTC/USDT Daily OHLCV (Volume USDT)
- Pearson correlation (r)
- 0.6215
- Spearman correlation
- 0.7607
- p-value
- 0
- Sample size (n)
- 1855
- 95% confidence interval
- 0.5927 to 0.6487
- Granger causality
- None
- Granger optimal lag
- 1
- Time coverage
- 2017-08-17 to 2022-09-14
AI analysis
Analysis of Ethereum HashRate vs. Binance BTC/USDT Volume Relationship
1. What the Visualization Reveals
The scatterplot displays a positive but noisy relationship between two variables that both appear to be proxies for overall crypto market activity/scale. As the X-axis metric (labeled as Ethereum HashRate but with values in the billions, suggesting it may actually be mislabeled volume or market-cap-like data) increases, the Y-axis metric (BTC/USDT trading volume) tends to rise as well, but with substantial scatter rather than a tight linear band. The data spans nearly four orders of magnitude on X (roughly 1M to 13.5B) and about one order of magnitude on Y (83 to 1,065), indicating heavy right-skew in X that likely reflects the explosive volatility of crypto markets over the 2017–2022 window, including bull runs (2017, 2020-21) and crashes.
2. Strength, Direction, and Statistical Confidence
The Pearson correlation of r = 0.62 indicates a moderate positive relationship, and r² = 0.386 tells us that only about 38.6% of the variance in Y is explained by X — meaning the majority (61%) of Y's variability is driven by other factors entirely unrelated to this X variable. The correlation is highly statistically significant (p ≈ 0), and the tight 95% CI [0.593, 0.649] confirms this relationship is not a sampling artifact — with n=1,855 we have strong confidence the true population correlation sits in this range. However, statistical significance here reflects large sample size more than practical predictive strength; r²=0.39 is a moderate, not strong, effect size for forecasting purposes. Critically, the Granger causality tests show no significant predictive direction in either direction (X→Y: p=0.49; Y→X: p=0.40). This means neither variable helps forecast future values of the other over time — the correlation is likely driven by both series responding to a common underlying factor (overall crypto market cycles/sentiment) rather than one causing the other.
3. Notable Patterns and Outliers
Several features stand out in the sample data: - Heteroscedasticity: variance in Y increases substantially as X increases — at low X values (< 500M), Y is tightly clustered between 100-250, but at higher X values, Y ranges wildly from ~270 to over 1000. - Vertical scatter at similar X: e.g., X≈1.08B yields Y=165 in one point but Y=1016 in another (likely temporal — same "level" of X metric at different points in the price cycle, e.g., rising vs. falling market phase). - Right-skewed X distribution: mean (1.26B) is far below what a symmetric distribution would suggest relative to the max (13.5B), with most points clustered under 1B and a long tail of extreme values. - The note that Spearman ρ exceeds Pearson r confirms a monotonic but non-linear relationship — likely logarithmic given the extreme skew in X, meaning a log-transform of X would likely produce a tighter, more linear fit.
4. Confounding Factors and Caveats
Both variables are downstream indicators of overall crypto market activity, price level, and speculative interest — they are not independent measurements. Bull markets simultaneously drive up trading volumes, hashrate, and prices across essentially all crypto assets, so correlation here likely reflects shared macro/market-cycle exposure rather than a direct mechanical link between Ethereum hashrate and Binance BTC volume. Additionally, there's a labeling inconsistency in the metadata (X-axis described as "HashRate" but sourced from BTC/USDT OHLCV data, Y-axis described as Ethereum data but sourced from BTC "Volume USDT") — this suggests possible data pipeline/column-mapping errors that should be verified before drawing conclusions. Time-series data like this also violates independence assumptions of Pearson correlation (autocorrelation inflates apparent significance), which the Granger test result underscores — the "relationship" may partly be an artifact of both series trending together over 2017-2022 rather than genuine covariation.
5. Suggestions for Further Investigation
1. Verify data labeling/source mapping — confirm which actual metrics are being compared, as the current axis descriptions appear inconsistent with their stated sources. 2. Apply log-transformation to X (given its 4-order-magnitude range and skew) and re-run regression/correlation — likely to reveal a tighter, more interpretable relationship and address the Pearson/Spearman divergence. 3. Detrend or difference the series before correlation analysis to remove shared trend/cycle effects and test whether genuine short-term co-movement exists. 4. Segment by market regime (bull vs. bear, or by year) to check if the relationship strength varies across different market conditions — the extreme scatter at high X suggests regime-dependent behavior. 5. Given the null Granger causality result, avoid using either series to "predict" the other in trading models; instead treat both as coincident indicators of market-wide activity and explore a third common driver (e.g., total crypto market cap, BTC price itself) as the more fundamental variable.
X dataset: CryptoDataDownload – Binance BTC/USDT Daily OHLCV
Y dataset: Ethereum Historical Price Data
Part of experiment: Bitcoin - CryptoDataDownload – Binance BTC/USDT Daily OHLCV vs Ethereum Historical Price Data