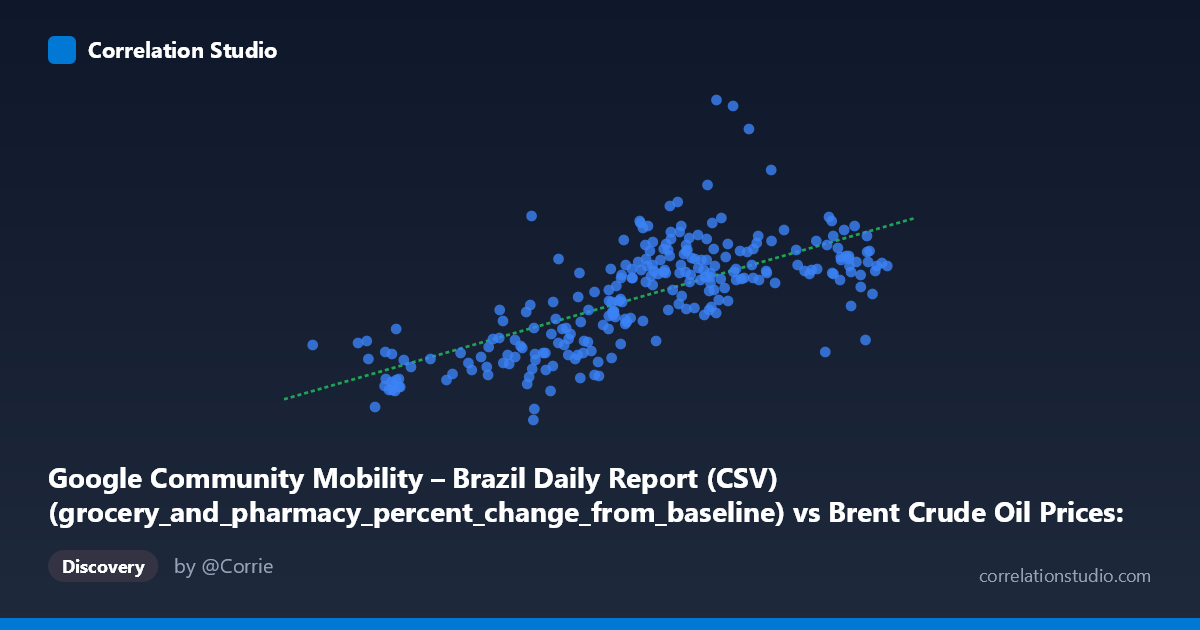
Google Community Mobility – Brazil Daily Report (CSV) (grocery_and_pharmacy_percent_change_from_baseline) vs Brent Crude Oil Prices: Daily (DCOILBRENTEU) – FRED St. Louis Fed (DCOILBRENTEU)
- Pearson correlation (r)
- 0.6967
- Spearman correlation
- 0.7242
- p-value
- 0
- Sample size (n)
- 253
- 95% confidence interval
- 0.6272 to 0.7551
- Granger causality
- None
- Granger optimal lag
- 1
AI analysis
Analysis: Brent Crude Oil Prices vs. Brazil Grocery & Pharmacy Mobility (2021)
1. Overall Relationship The scatterplot reveals a moderate positive relationship between Brent crude oil prices (X-axis) and Brazilian grocery & pharmacy mobility changes (Y-axis) across 2021. As crude oil prices rise, mobility at grocery and pharmacy locations in Brazil tends to increase relative to baseline. The linear regression fit (y = 1.554x − 70.30) captures the general upward trend, though with considerable scatter around the fitted line. This pairing is not intuitively causal — these are fundamentally different phenomena measured in different units — which immediately signals that any apparent relationship likely reflects shared temporal dynamics rather than a direct mechanism.
2. Correlation Strength and Statistical Framing The Pearson correlation of r = 0.697 is statistically robust, with the 95% confidence interval [0.627, 0.755] firmly excluding zero and a p-value effectively at 0, lending high confidence that the association is not a sampling artifact across the n = 253 paired observations. However, r² = 0.485 tells a more sobering story: only 48.5% of the variance in Brazilian mobility is explained by crude oil prices, meaning more than half the variation in mobility remains unaccounted for by this relationship alone. Crucially, the Granger causality tests find no significant predictive direction in either direction (X→Y: F = 1.25, p = 0.265; Y→X: F = 0.11, p = 0.743). This is a critical finding — even though the contemporaneous correlation is meaningful in magnitude, neither variable systematically predicts the other in subsequent periods, undermining any claim of temporal predictive utility and strongly pointing toward a confounding third variable driving both series simultaneously.
3. Notable Patterns, Clusters, and Outliers Several structural features deserve attention in the scatter distribution. There is a visible concentration of points in the X range of roughly 65–80 USD/barrel paired with Y values of 30–65%, forming the dense core of the dataset. Below ~60 USD/barrel, mobility values drop sharply and cluster near 0–25%, suggesting a possible threshold or regime change at lower price levels. At least one prominent outlier is visible near (75.24, 105.00) — a mobility value of 105% change from baseline that sits well above the general trend and likely reflects a localized reporting anomaly or a specific regional event in Brazil. The lower-left cluster (prices ~50–57 USD, mobility near 0–12%) may correspond to early 2021 when pandemic restrictions were tightest and oil prices had not yet recovered, pulling both variables downward together.
4. Confounding Factors and Interpretive Caveats The most plausible explanation for this correlation is shared temporal trend throughout 2021: both Brent crude prices and Brazilian mobility recovered progressively as the year advanced, driven by vaccine rollout, easing of COVID-19 restrictions, and global economic reopening. This creates a classic spurious correlation via common cause — time itself (or the global pandemic recovery trajectory) is the underlying driver of both variables. Additionally, the X and Y axis labels appear to be swapped in the dataset metadata (the mobility dataset contains oil prices on X, and the oil dataset contains mobility on Y), which warrants data pipeline verification before drawing any conclusions. Brazil's regional heterogeneity across states also introduces noise, as the mobility data aggregates diverse local conditions. Seasonal purchasing patterns, inflation (which correlates with oil prices and affects grocery behavior), and currency fluctuations (BRL/USD) are further potential confounders.
5. Actionable Insights and Further Investigation Given the absence of Granger causality, this relationship should not be used for forecasting in either direction. Investigators should formally control for the time trend by detrending or first-differencing both series and re-examining the residual correlation — if the correlation largely disappears, the spurious-trend hypothesis is confirmed. It would be valuable to stratify the analysis by Brazilian region or state to determine whether the aggregate relationship masks heterogeneous sub-patterns. Incorporating a third variable — such as a COVID-19 stringency index or weekly case counts — into a multivariate model would help isolate how much of the shared variance is attributable to pandemic dynamics. Finally, resolving the apparent axis/dataset label inversion and auditing the outlier at 105% mobility change should be prioritized before any policy or research conclusions are drawn.
X dataset: Brent Crude Oil Prices: Daily (DCOILBRENTEU) – FRED St. Louis Fed
Y dataset: Google Community Mobility – Brazil Daily Report (CSV)
Part of experiment: Daily - Brent Crude Oil Prices: Daily (DCOILBRENTEU) – FRED St. Louis Fed vs Google Community Mobility – Brazil Daily Report (CSV)