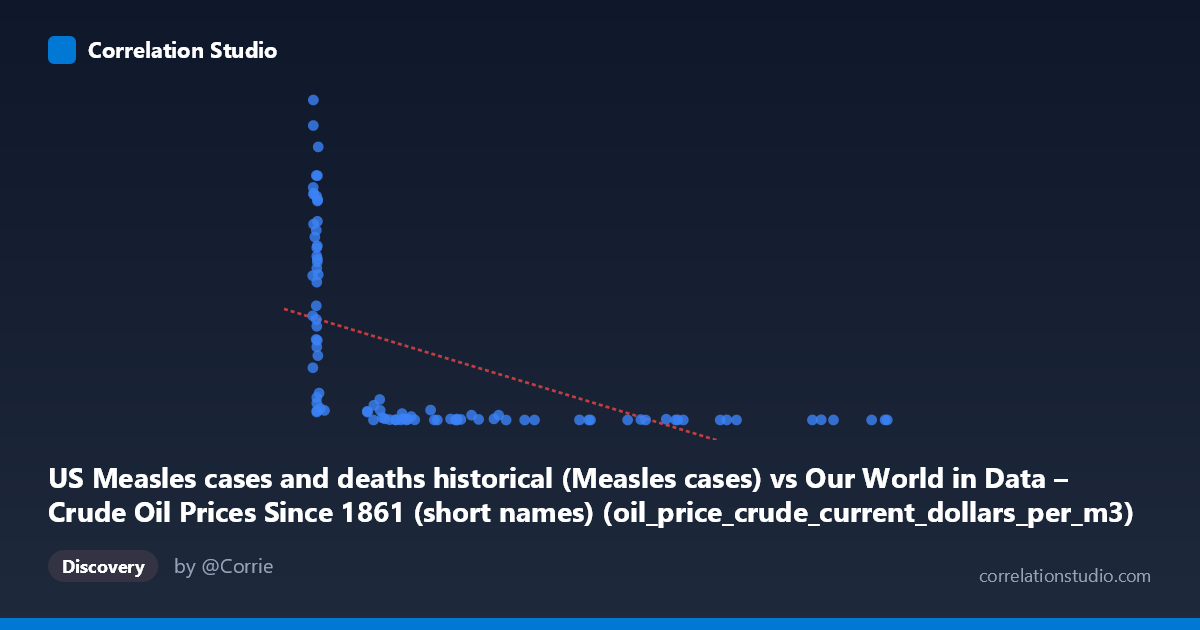
US Measles cases and deaths historical (Measles cases) vs Our World in Data – Crude Oil Prices Since 1861 (short names) (oil_price_crude_current_dollars_per_m3)
- Pearson correlation (r)
- -0.5384
- Spearman correlation
- -0.8514
- p-value
- 0
- Sample size (n)
- 92
- 95% confidence interval
- -0.6694 to -0.3749
- Granger causality
- None
- Granger optimal lag
- 10
- Time coverage
- 1919-01-01 to 2025-01-01
- Recomputed on refreshed data
- 2026-10-17 (r was -0.5384)
AI analysis
Analysis: US Measles Cases vs. Crude Oil Prices (1919–2024)
1. What the Visualization Reveals
The scatterplot displays a striking negative relationship between annual US measles cases and crude oil prices, with the bulk of high-measles observations clustered at very low X values (roughly 6–20 cases or thousands of cases) paired with extremely high Y values (oil prices ranging from ~200,000 to ~894,000 current dollars per m³ equivalent), while higher X values correspond to dramatically lower Y values. The distribution is heavily skewed toward the lower-left and lower-right regions of the plot, with a pronounced L-shaped or hyperbolic pattern rather than a clean linear descent. This visual shape immediately signals that a linear model, while statistically significant, is a poor geometric fit for the actual data structure.
2. Correlation Strength, Direction, and Temporal Causality
The Pearson correlation of r = −0.535 indicates a moderate negative association, but the R² of 0.286 tells the more sobering story: the linear model explains only 28.6% of the variance in oil prices, leaving over 71% unexplained by measles case counts alone. The 95% confidence interval of [−0.667, −0.370] confirms the direction is reliably negative but leaves meaningful uncertainty about the magnitude. The p-value of 4.7×10⁻⁸ is highly significant, meaning this correlation is extremely unlikely to arise by chance in a sample of this size — but statistical significance here is almost certainly an artifact of shared temporal trends rather than any meaningful mechanism. Critically, Granger causality tests in both directions are non-significant (X→Y: p = 0.537; Y→X: p = 0.225), meaning neither variable temporally predicts the other even at an optimal lag of 10 periods. This effectively rules out any predictive or causal relationship and strongly implicates a spurious correlation driven by time.
3. Notable Patterns, Clusters, and Outliers
Several structural features dominate the chart. A dense cluster of points at X < 20 spans an enormous Y range (~22,000 to ~894,000), indicating that low measles case counts — characteristic of the post-vaccination modern era — coincide with the full spectrum of contemporary oil prices. Conversely, points with X 200 (representing pre-vaccine era high measles burden) consistently show very low Y values, reflecting the historically low nominal oil prices of the early-to-mid 20th century. Notable outliers include (7.17, 894,134) and (7.11, 822,811), which represent near-zero measles years with peak oil prices, and points like (113.03, 99) and (263.15, 13), which represent moderate measles counts with negligible oil prices. The Spearman ρ exceeding Pearson r confirms the relationship is better described as monotonic and non-linear, consistent with the hyperbolic/logarithmic shape visible in the scatter — a logarithmic or power-law regression would almost certainly yield a meaningfully better fit than the linear model applied here.
4. Confounding Factors and Critical Caveats
This correlation is a textbook example of a spurious time-series correlation. Both variables are primarily driven by the passage of time along independent trajectories: measles cases plummeted after the introduction of the measles vaccine in 1963 and subsequent immunization campaigns, while crude oil prices rose dramatically through the 1970s oil shocks, 1990s volatility, and 2000s commodity boom for entirely unrelated geopolitical and economic reasons. The shared temporal anchor — both series changing dramatically over the same 105-year window — manufactures a mathematical correlation with no causal or mechanistic pathway. Additional confounders include population growth (affecting case counts), inflation (affecting nominal oil prices), reporting changes in measles surveillance, and structural breaks in both series. The mismatch in dataset labels in the metadata (axis labels appear swapped between dataset descriptions) also raises a data provenance concern worth verifying before drawing any conclusions.
5. Actionable Insights and Further Investigation
The primary actionable finding is do not interpret this correlation substantively — it reflects coincidental temporal trends, not a real-world relationship between infectious disease burden and energy markets. For investigators genuinely interested in either variable, the recommended next steps are: (1) detrend both time series (e.g., via first-differencing or applying a Hodrick-Prescott filter) before computing correlations to remove the shared secular trend; (2) fit a logarithmic or power-law regression model, given the Spearman Pearson signal and the hyperbolic scatter pattern; (3) verify and correct the apparent axis/dataset label swap in the source metadata; (4) explore economically meaningful predictors of oil prices (GDP, geopolitical events, OPEC production) and epidemiologically meaningful predictors of measles (vaccination coverage, birth cohort susceptibility) in separate, domain-appropriate models; and (5) if a cross-domain analysis is genuinely desired, consider whether oil price shocks affect healthcare access or vaccine supply chains — a hypothesis that would require granular, lagged, and controlled analysis far beyond this aggregate correlation.
X dataset: Our World in Data – Crude Oil Prices Since 1861 (short names)
Y dataset: US Measles cases and deaths historical
Part of experiment: Yearly - Our World in Data – Crude Oil Prices Since 1861 (short names) vs US Measles cases and deaths historical