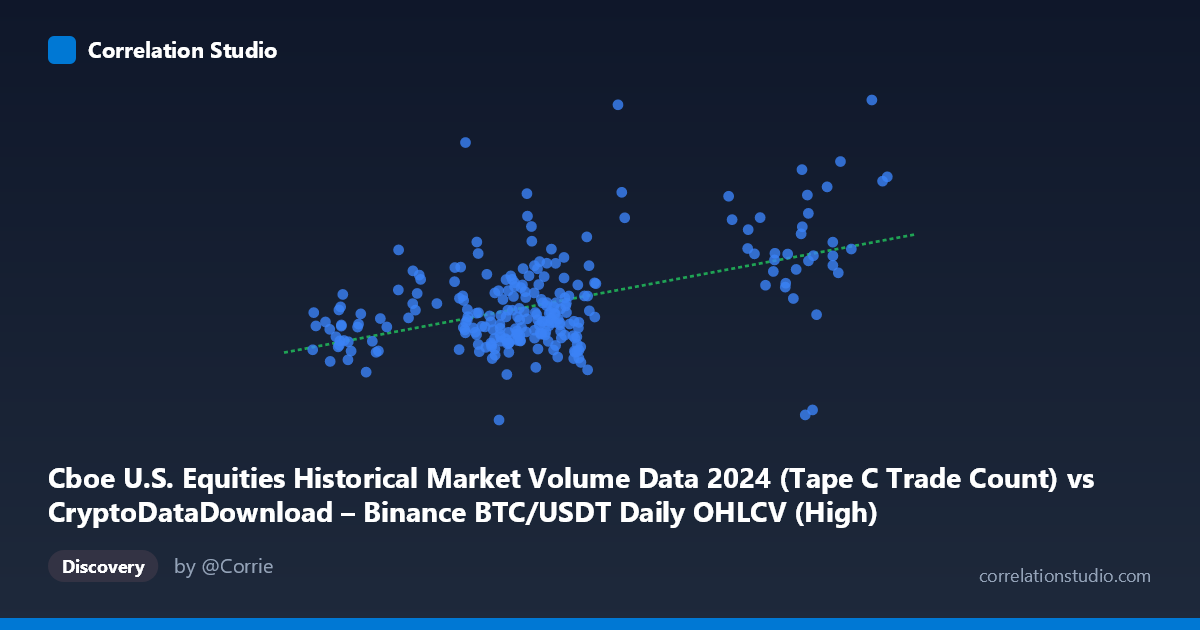
Cboe U.S. Equities Historical Market Volume Data 2024 (Tape C Trade Count) vs CryptoDataDownload – Binance BTC/USDT Daily OHLCV (High)
- Pearson correlation (r)
- 0.4926
- Spearman correlation
- 0.3502
- p-value
- 0
- Sample size (n)
- 252
- 95% confidence interval
- 0.3929 to 0.5808
- Granger causality
- None
- Granger optimal lag
- 10
- Time coverage
- 2024-01-02 to 2024-12-31
AI analysis
Analysis: Trade Count vs. BTC/USDT Daily High
1. What the Visualization Reveals
The scatterplot shows a moderate positive relationship between Cboe equities trade count (Tape C) and Binance BTC/USDT daily high prices. Points cluster predominantly in the X range of 55,000–75,000 trades, with a secondary, more sparsely populated cluster extending toward 96,000–108,000. The bulk of the data forms a loosely upward-sloping cloud rather than a tight linear band, indicating a real but noisy association rather than a deterministic relationship.
2. Strength, Direction, and Statistical Confidence
The correlation coefficient (r = 0.493) indicates a moderate positive relationship, but r² = 0.243 reveals that only about 24% of the variance in BTC's daily high is explained by equity trade counts — leaving roughly 76% attributable to other factors. The 95% CI [0.393, 0.581] is reasonably tight and excludes zero, and the p-value (effectively 0) confirms the correlation is statistically significant and not due to chance in this sample. However, statistical significance with a large N (3,212) should not be conflated with practical strength — a correlation this size explains only about a quarter of the variability, meaning trade count alone is a weak predictor of BTC price levels.
Critically, the Granger causality tests show no significant predictive direction in either direction (X→Y: p=0.303; Y→X: p=0.443). This means that past values of one series do not help forecast future values of the other beyond what each series' own history provides, even at the optimal lag of 10 periods. This strongly suggests the contemporaneous correlation is not causal in a temporal/leading sense — it may instead reflect a shared external driver (e.g., macro market conditions, risk sentiment) affecting both series simultaneously rather than one leading the other.
3. Notable Patterns and Outliers
Several features stand out: - Two X-density regions: a dense cluster below ~75,000 trades and a thinner, more scattered group above 96,000, suggesting possible regime shifts in equity trading activity (e.g., high-volatility days). - Outliers: The point (62,285.94, 1,260,223.79) sits at the extreme low end of Y despite a mid-range X value — likely an early-year data point given BTC's price trajectory in 2024. Similarly, (58,305.59, 2,801,223.32) is a high-Y outlier with unremarkable X, and (98,988.00, 2,407,797.00) shows high X paired with high Y, fitting the trend loosely. - Heteroscedasticity: Variance in Y appears to increase somewhat with X, hinting at non-constant variance rather than a strictly homoscedastic linear fit. - No strong evidence of a nonlinear (e.g., logarithmic or exponential) pattern is visually dominant, though the sparse high-X tail makes the slope estimate sensitive to a few points.
4. Confounding Factors and Caveats
This pairing is inherently unusual: it compares U.S. equity market trade counts to cryptocurrency prices, two markets with different trading hours, participants, and regulatory environments. Any correlation is more likely mediated by broader macroeconomic factors — such as overall market liquidity, risk-on/risk-off sentiment, VIX-driven volatility, or systematic days of high trading activity across all asset classes (e.g., FOMC announcements, quarterly rebalancing) — rather than a direct mechanical link. Additionally, BTC's 2024 price trajectory (which saw significant appreciation over the year) introduces a trend/time-confound: both series may simply be rising or fluctuating over the same calendar period, inflating correlation without genuine interaction (spurious correlation via shared time trend).
5. Suggestions for Further Investigation
To clarify whether this relationship is meaningful: - Detrend both series (e.g., first-differencing or removing time trend) before recomputing correlation, to rule out spurious trend-driven association. - Test correlation against a third variable (e.g., VIX, overall market volume, DXY) to identify a common driver. - Segment the analysis by quarter or volatility regime to see if the correlation is stable or concentrated in specific periods (e.g., driven by the high-X outlier cluster). - Given the null Granger causality result, avoid using trade count as a leading indicator for BTC price in forecasting models; instead, treat any relationship as coincidental/contemporaneous rather than predictive.
X dataset: CryptoDataDownload – Binance BTC/USDT Daily OHLCV
Y dataset: Cboe U.S. Equities Historical Market Volume Data 2024
Part of experiment: Bitcoin - CryptoDataDownload – Binance BTC/USDT Daily OHLCV vs Cboe U.S. Equities Historical Market Volume Data 2024